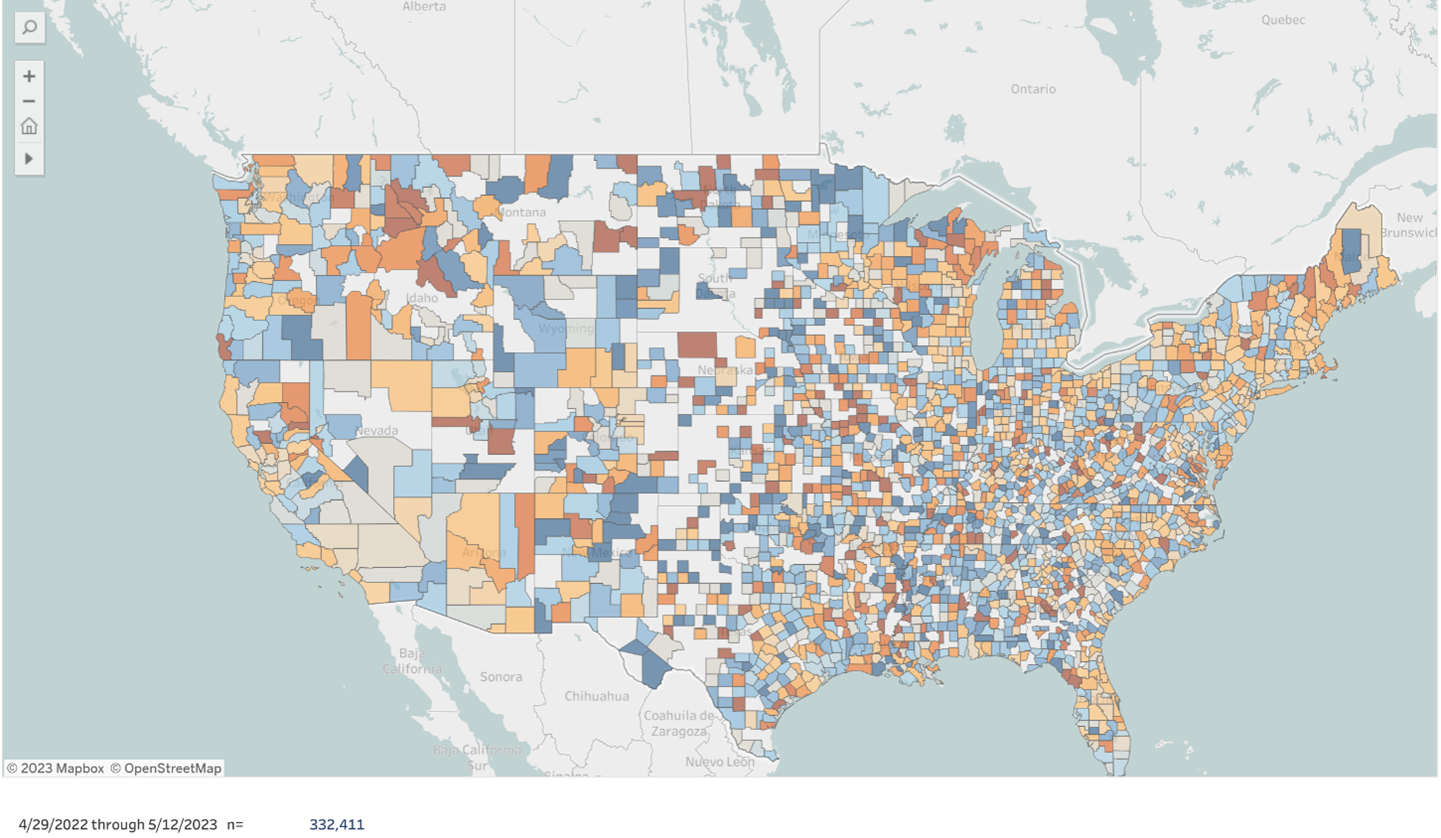
One of the key questions around the happiest and unhappiest home internet counties is where they are and what the driver is behind the happiness and unhappiness. Every week, we ask our respondents a battery of questions around how satisfied they are with the service they receive. After surveying more than three hundred and thirty thousand respondents later, we have respondents from 2,368 counties out of 3,142 in the United States telling us are telling us where the happiest and unhappiest broadband customers in the United States and allows us to determine the root cause behind their experience.
Questions that we aim to answer include: Why is home internet service in some places better than in others? Will the famous opening lines of Leo Tolstoy’s book Anna Karenina – “All happy families are alike; each unhappy family is unhappy in its own way” – be applicable here? Are the larger observable trends, where fixed wireless NPS outperforms Fiber – which outperforms cable, which beats DSL and WISPs – be consistent in a granular county-by-county perspective? Does it matter if a county is in a blue state or a red state? Is the size of a provider any indication that the home internet customers in a county are happier or unhappier? Let’s just say that counties do not show the same behavior as Tolstoy’s families: it all comes down to local execution.
Let’s get politics out of the way first: Five of the ten unhappiest and five of the ten happiest counties are in states that are considered “Republican” and “Democratic”, respectively. Neither party’s approach to how they interact with home internet providers has had an impact on the distribution of the ten happiest and unhappiest counties.
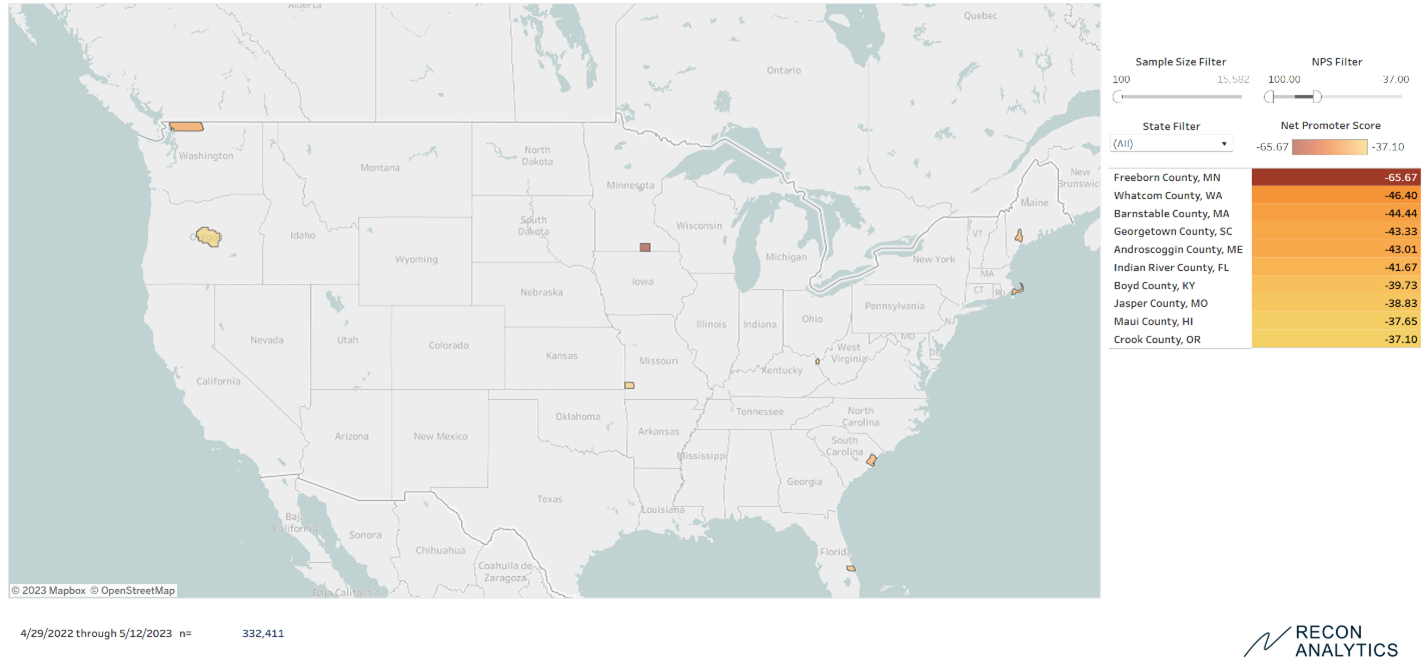
Below is a map of the ten unhappiest home broadband counties in the United States with at least 100 respondents to ensure statistical veracity.
Interestingly, all the counties where the unhappiest home broadband customers are residing are rural counties with one exception: Indian River County, FL, the home of Vero Beach. This county, which is largely suburban, has the fourth highest concentration of millionaires on the United States. The population range per county is between 25,000 and 180,000 people. They are being served by between two providers in Barnstable County, MA and 14 providers in Jasper County, MO, which tells us that limited or significant choice is not a driver of unhappiness, especially when all of the counties are served by all technologies from fiber to DSL. Even if we controlled for coverage, we had some counties where there was fiber coverage in every ZIP-code (we did not check if every physical address was covered) like Georgetown County, South Carolina, Indian River County, FL, or Crook County, OR to where almost none of the ZIP-codes in a county, like Barnstable County, MA, were covered by fiber. These type of systemic, technology-driven or industry structural reasons are not providing the answer, despite being commonly accepted truths. In four of the ten unhappiest counties, membered own co-operatives which are typically non-profits were active.
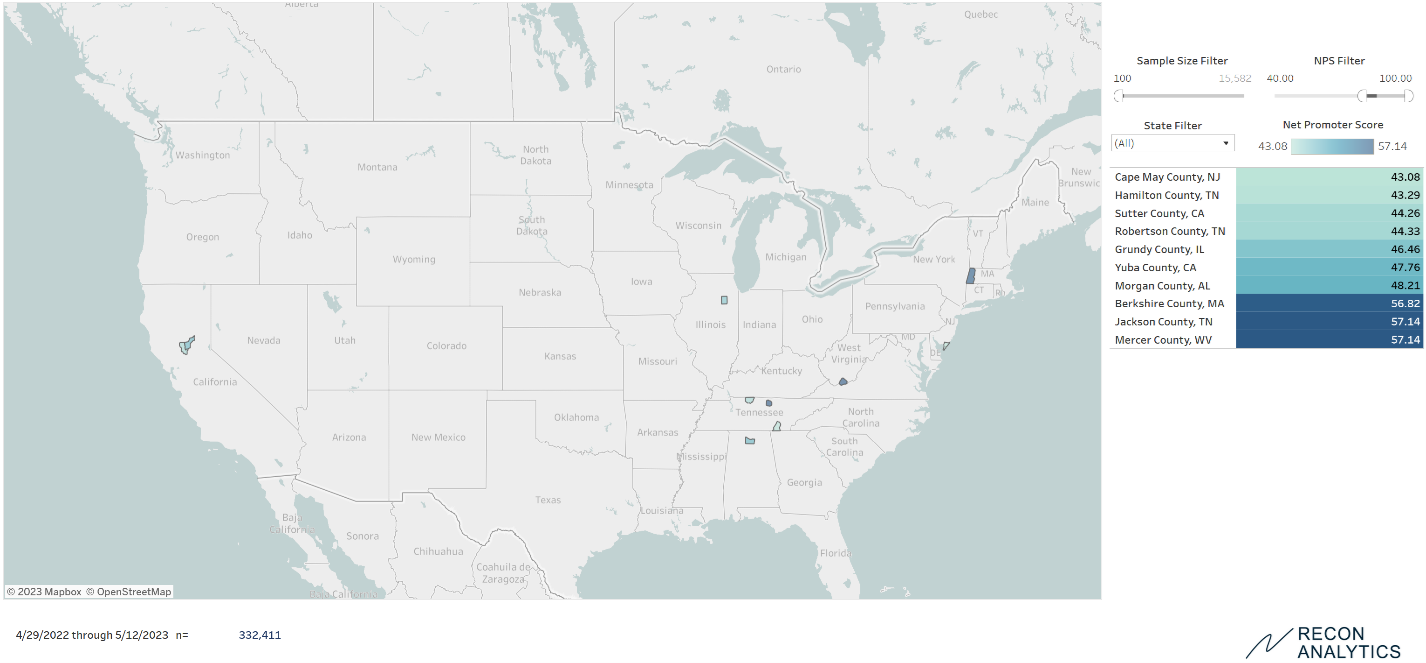
We then looked at the happiest home broadband counties in the United States. The map confounds the expectations of many.
Who would have thought that four of the happiest broadband counties are in the rural South of Tennessee, Alabama and West Virginia? Nine of the ten happiest counties are rural. In six of the ten happiest counties, coops are active, but not in the happiest broadband county, Mercer County, WV. The poster child for municipal broadband, Chattanooga, TN, comes in as the 9th happiest home internet place in the country. The happiest county, Mercer County, WV does not have any coops providing telecom services there. In six of the happiest and four of the unhappiest broadband counties, coops are providing service. The mere presence of coops is providing better services, as the feedback we receive from customers ranges from terrific to terrible. Fiber or Cable coverage is also not playing a determining role.
The other fascinating insight is what is missing from the list: major urban markets. The idea that urban markets get all the investment because they are densely populated and cheaper to service, and therefore have the happiest broadband customers, is just not reflected in the data. At the same time, the rival argument that urban areas are dystopic wastelands with horrible broadband service is equally not supported by the data.
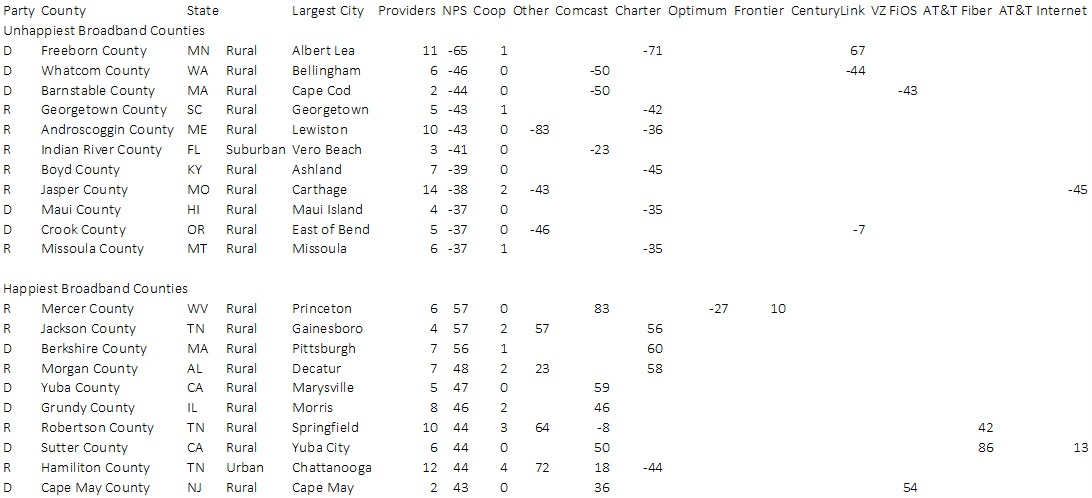
In the end, we found that what really matters is the individual performance of a provider in a given county. Below are the NPS scores for the providers with at least 20 respondents in each county where we had at least 100 respondents overall.
Almost all the providers displayed uneven performance. The same provider that performed very well in some counties performed poorly in others. Cable providers like Comcast and Charter performed very well in some counties. Comcast’s exceptionally good performance made Mercer County, WV the happiest broadband county. Equally, its poor performance in Barnstable County, MA and Whatcom County, WA made them the second and third unhappiest broadband counties. Only AT&T Fiber performed consistently well in the ten happiest counties and was not present in the unhappiest.
Additionally, 5G fixed wireless service did not make an impact on the happiest and unhappiest broadband counties. While in some of the counties there is 5G fixed wireless service, the adoption numbers were so low that they didn’t make an impact on the overall happiness of broadband customers.
Our research shows that every provider is able to do excellent work and make their customers happy. Considering that the nationwide providers engage in nationwide standard pricing, the satisfaction score differences are not driven by low price, but by actual performance. Technology helps, but the key is local execution. Providers could improve their performance in markets by internally benchmarking their performance and extending best practices throughout the entire organization. Regulators should look at how satisfied the customers of applicants are before the allocate their broadband subsidies to expand services. If they have multiple applicants for subsidies, they should be given to the providers who deliver for the taxpayers, who provided the funds through taxes in the first place.
Qualcomm is the quintessential American tech company steeped it engineering excellence. Its genesis was the development of a new wireless standard called CDMA. Initially, it was written off as a failure, often ridiculed by its larger global rivals. It created a niche by getting American mobile providers like Verizon, Sprint and South Korean mobile providers like SK Telecom to adopt its technology. Qualcomm found redemption as the mobile providers often had the best networks in their respective countries, better than the globally dominant GSM standard. It found salvation when a variant of its CDMA standard was adopted as the global 3G standard called Wideband CDMA or to those who still harbored old animosities UMTS. It then became the global leader in 4G by holding most of the patents on the OFDM technology that underlies LTE.
By the late 2010s, Qualcomm that engineered itself through superior technology to unprecedented success was faced with five major problems that no engineering solution could easily fix.
Despite being the premier mobile technology company growth had slowed down as upstarts like MediaTek was gaining market share, first in the entry level, highly price sensitive segment but was closing the performance gap between the solutions of the two companies. Qualcomm still dominated the flagship segment, but MediaTek dominated the entry level.
Broadcom launched a hostile takeover to buy Qualcomm as investors were frustrated with low stock returns. Broadcom was only thwarted through the intervention of the US government.
Qualcomm’s largest customer Apple with the support of the Department of Justice was using the courts as a price negotiation tool.
The Android smartphone market was increasingly concentrating with Samsung and Chinese providers driving other manufacturers out of the market. Former mobile phone giants like LG and HTC exited the market.
The relationship between the United States and China was becoming increasingly hostile. The US government instituted unprecedented sanctions against Huawei and imposed trade restrictions on semi-conductors.
Qualcomm CEOs are engineers at heart, Irwin Jacobs, the legendary founder; his son Paul, and Steve Mollenkopf. While Cristiano Amon is also an engineer has cut his chops as President of Qualcomm by spearheading the diversification of Qualcomm into more business segments and therefore to enable Qualcomm to participate in more growth sectors.
Under Cristiano Amon the company is continuing to focus on mobile and IoT but is expanding into computing and automotive. By doing so Qualcomm has expanded its addressable market from $15 billion to over $700 billion. The impact has been almost immediate. Qualcomm has now a $30 billion design win pipeline until 2030.
How did he do this? Qualcomm purchased several companies to strengthen its position in the respective sectors. It bought Cellwize and Augmented Pixels to improve its positioning in mobile, Clair AIR to strengthen its capabilities in the AR/VR area. But most importantly, Qualcomm bought Nuvia, a company focusing on ARM-based computing solutions and Arriver, a company with particular strength in advanced driver assistance software and hardware. And just a last week, Qualcomm acquired Autotalks, a fabless chipmaker making silicon and systems-on-chip for automotive safety.
The Nuvia acquisition is laying the ground work to strengthen Qualcomm’s core base of computing, just like the acquisition of P.A. Semi in 2008 did for Apple. P.A. Semi focused on low power processors and brought to Apple the expertise to build first the A-series chips that have powered iPhones since 2010 and now the M-series chips that were launched in 2020. If Apple’s success is any indication then ARM-based processors are going to be the processors of the foreseeable future. The power envelope of compute power, electric power consumption and heat generation are not on the side of x86 processors, but ARM-based processors. It could also help Qualcomm to close the mobile processor speed gap between itself and Apple A-series processors and increase the gap between Qualcomm and MediaTek processors. Faster, more powerful processors will also help in Qualcomm’s greatest growth market: automobiles.
Where Qualcomm is most likely to replicate the strong position it has in mobility is in electric vehicles. Qualcomm has created a comprehensive solution for automobile manufacturers called Snapdragon Digital Chassis. It combines safety and connectivity with entertainment, customization and upgradability. It takes the basic lessons of a smartphone and takes it to the automobile. The parallels and similarities as the car becomes essentially a mobile server are striking. Qualcomm is coming into this market at the right time when other’s have laid a foundation for the demand, but Qualcomm has the more comprehensive and elegant solution. Qualcomm has also the opportunity to provide a solution that rivals that of Apple. Apple’s Carplay service is viewed by many car manufacturers as a bear-hug take-over of a large part of the user interface between the drivers and passengers of the car most of the navigation and entertainment interface. Automobile manufacturers are especially sensitive due to the long-rumored Apple project to build their own electric car and Google’s Waymo autonomous car company. The car manufacturers know Apple and Google do not come in peace and do mean harm to them. Car manufacturers have to own the user interface between the vehicle and the customer, but know their solution has to be on-par if not better than that of Apple and Google. Working with Qualcomm gives them a chance to do that and so much more. In addition, while there exists significant brand loyalty for traditional car buyers with more than 50% of owners of one car brand to own a car from the same car brand, this loyalty does not exist when it comes to the switch to an electric vehicle. This levels the playing field and is an incredible threat to incumbents and opportunity for new market entrants. Tesla is the embodiment of this new generation of automobile manufacturers. While Tesla had to pioneer a lot of the systems themselves, the next generation electric vehicles can rely on integrated solutions from a company like Qualcomm. Car manufacturers like General Motors, Cadillac, Stellantis, and Mercedes-Benz as well as BMW, Hyundai, Nio and Volvo are in varying degrees of partnership with Qualcomm. Such an array of car manufacturers and a solution that offers breadth and depth gives Qualcomm critical mass to win the automotive market. Who would have thought three years ago?
Inflation has become a top-of-mind concern for everyone, leaving consumers, businesses, and the investment community on the edge of their seats. How are consumers reacting to the largest increase in prices of the last four decades? Which businesses get impacted and does Wall Street come to the correct conclusions?
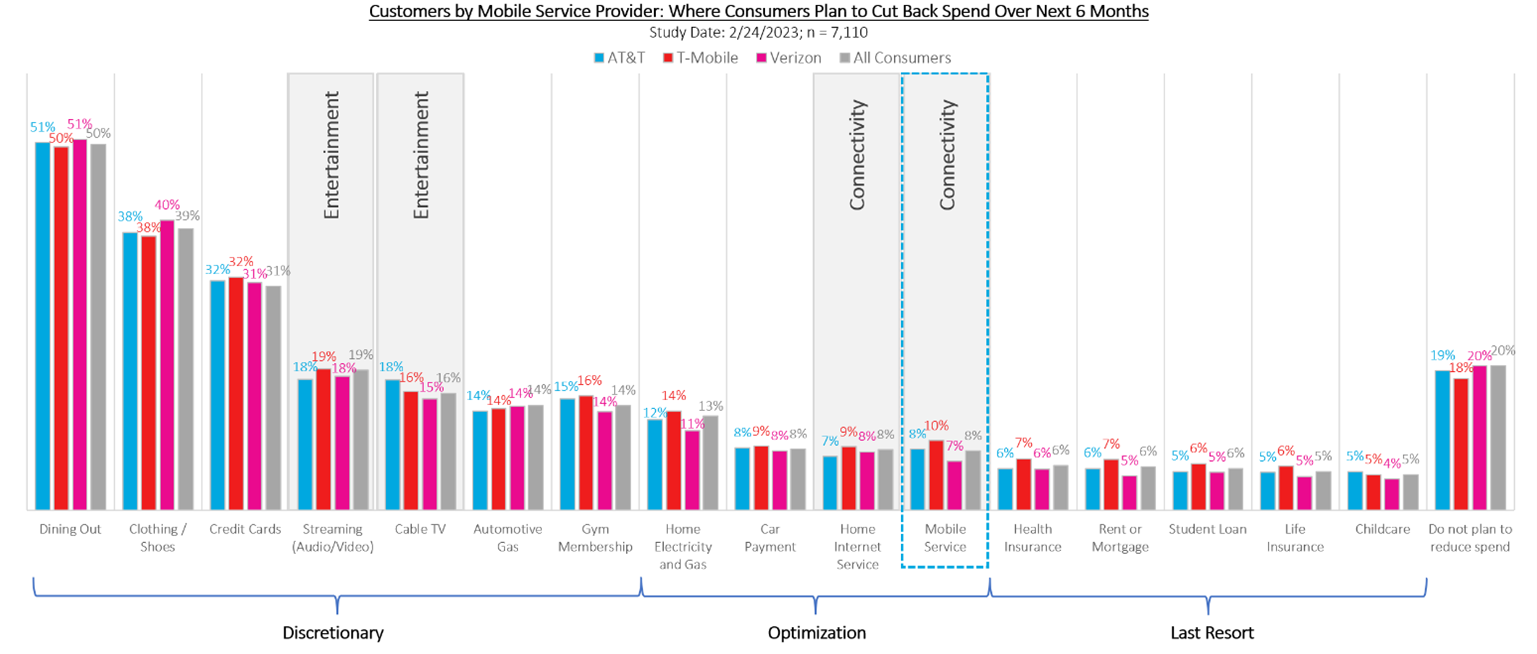
At the end of February 2023, we ran a module as part of our weekly Mobile Consumer and Home Internet Pulse surveys with 7,110 respondents telling us in which spending areas they would cut back. In a nutshell, people would rather cut back on electricity, heating or car payments than home internet or mobile service.
By far the number one category where consumers are cutting back is dining out. A whopping 50% of consumers are expected to increase their at-home dining and reduce their spending at restaurants. It’s the easiest way to cut back as consumers, now trained in the art of cooking due to the Pandemic, can easily replace an expensive meal with home cooking. At the same time McDonalds is at an all-time high stock price based on cutting their regional sales structure. You can’t cut yourself to growth. Verizon is a cautionary tale of what happens when you cut your regional sales structure and take away the ability to build a deep and wide management bench by having a large number of P&Ls where people can learn the business. Dining out is followed by clothes shopping where 39% of respondents are curbing their spending. It’s not that people will walk around in rags, but the pace of clothing purchases is going down, especially hurting the fast fashion segment. General consumer spending through credit cards was mentioned by almost one-third of consumers as a means to address increasing prices.
Scaling back on streaming services is the fourth most popular expenditure reduction segment among consumers, with 19% planning to reduce their spending on streaming video and audio services. We run a monthly Streaming Content Module that receives over 90,000 respondents annually, in which we explore the streaming habits of Americans. According to our April 2023 Streaming Content Module based on 7,642 respondents, on average, consumers have access to 3.6 subscriptions – 2.5 subscriptions for which they pay out of pocket, 0.6 subscriptions received through a mobile service or home internet bundle and 0.5 subscriptions they get access to through password sharing. In addition, 16% of consumers are planning to cut their cable TV bundle ensuring that cord cutting continues and making the looming death of linear television ever more likely. We are not sure if the TV writer’s guild calling for a strike realizes that fewer and fewer people will realize that no new content is being produced. Some people might even use the lack of new content as a sign that it is time to cancel it all together.
Fourteen percent of respondents were planning to cut back on gas for their cars and on gym membership. Although many people rely on their cars to drive to work, there is a car-use component that is optional and can be reduced as a cost-saving measure.
Only eight percent of respondents are planning to cut back on their home internet and mobile service expenditures due to inflationary pressure, barely more than the number of people who will cut back on health insurance and housing. The difference between subscribers at MNOs is nominal with only 7% of AT&T customers at the low end and 9% of Verizon customers at the high end looking to reduce their spending on home internet services. The numbers on average are even lower for mobile service, with only 7% of T-Mobile customers and 8% of AT&T customers looking to reduce their mobile costs.
For the eight percent looking to reduce their mobile service expenses, their preferred route is to switch to a new provider that offers a similar plan to what they’re currently receiving but at a lower price point. Their secondary choice is to downgrade to a more affordable plan with their current provider. Savings via device discounts also play a significant role among this subset, with more than half willing to switch to a new provider to obtain the best deal on a new device to find further cost savings.
As a last cost-cutting resort, 6% of consumers would scale down their health insurance, rent or mortgage or student loan payments in response to inflationary pressure. Life insurance and childcare costs have the greatest inflationary-resistance, with only 5% of people looking to cut back costs within each category.
Lastly, despite inflation concerns throughout the economy, roughly 20% of respondents have indicated they do not plan to decrease their financial spending. With percentages this low, telecom has essentially become recession proof.
AST Spacemobile (AST) and AT&T just completed the first call between a regular smartphones using just the electronics and antennas that are common for decades in mobile devices using a satellite as the cell site. AST has talked about its technology for years, laid out its plans to investors and received only the scantest of interests. Unlike Apple’s technology that uses special chips in Apple’s new iPhone 14 smartphones to send text messages through a satellite connection the AST solution works with any phone. While T-Mobile and SpaceX’s announcement last year of bringing satellite connectivity to any phone was a vision statement, AT&T and AST’s call was the proof of concept. We know now that it works not only on paper but also in the field.
The first part of the feasibility study was the reverse of the actual proof of concept. AST put a cell phone on a satellite and built a base station on the ground. With this ingenious way, AST could exactly dimension the size of the antennas, the strength of the signal amplifiers, processing power requirements and the power consumption that the satellite would have in order to work in space and make the connections to smartphones from there. It is much easier to tinker with and faster to interate the hardware when it is on the ground than hundreds of miles in space.
The hard work begins now. Until now, the FCC has been a lot less accommodating to AST than the other innovative satellite providers. The FCC needs to allow AST to use regular terrestrial frequencies that have been exclusive to mobile service also for satellite service. Historically, the FCC has been very accommodating to satellite providers like Lightsquared to use their satellite frequencies for terrestrial communications, but this resulted in basically no usage for several reasons. The satellite to mobile spectrum conversion players forgot for the longest time to include their spectrum in mobile standards. If you are not in the standard, nobody will build devices that have your band in them. The next hurdle is to get devices that include a band that nobody is yet using for mobile communications as it costs money to include a new frequency band. This problem does not exist with the AST solution as all devices that have a cellular connection can connect to the satellite. What is needed from the FCC to move from a proof of concept to mass adopted reality is the permission to use regular cellular frequencies with satellites and the permission for AST to launch enough satellites. Then AST has to raise more money to build and launch the satellites.
Where AST and AT&T differentiate themselves is the data throughput they promise: Speeds of up to 50 Mbit/s and the ability for streaming video. While this is certainly handy when fighting wild fires in a remote part of a state or recovering victims from a plane crash in a remote part of the state, it becomes down right indispensable for people documenting on a live stream when they have climbed a mountain and then call first responders because they are too tired to climb back down.
While initially mentioned that the smartphone to satellite connections would be used just for FirstNet, it is almost inconceivable to stay restricted to first responders. The ability to eliminate outdoor dead spots and to provide full geographic coverage is huge. Based on our Recon Analytics Mobile Pulse data the ability to “make a calls anywhere” is the third most important purchase decision factor based on 161,976 respondents. From May 2022 to end of March 2023, 10.9% of respondents ranked it their most important decision factor choosing a mobile provider, 10.5% chose it number 2 and 10.9% as their third most important factor.
AT&T has a very promising solution on its hand. Bring ubiquitous outdoor coverage to first responders everywhere in the United States, something that has not been done before. But not only with text messaging with a long time delay like Apple does now and got a lot of accolades for, but with streaming video. This is a real game changer for first responders. It is also a game changer for consumers in areas with low signal strength or coverage holes outdoors. With AST’s technology they are gone. Consumers will still have to content with issues when being indoors as they do not have direct line of sight to the satellite and the buildings they are in are potentially interfering with the signal.
Now that we know this is possible, how quickly will regulators pull out all the stop signs that are preventing the real world application for it? How quickly can these satellite get into space and who will be the first to deliver ubiquitous outdoor coverage to first responders and consumers with what real world speeds?
The converged communications industry is undergoing significant change. It has been well reported that fixed wireless access has captured most of the broadband industry’s growth, followed by fiber, with cable not adding customers, while DSL gets rapidly replaced. Recon Analytics’ research also shows that a substantial number of fixed wireless access subscribers did not have dedicated home internet access before; hence, it is not a zero-sum game.
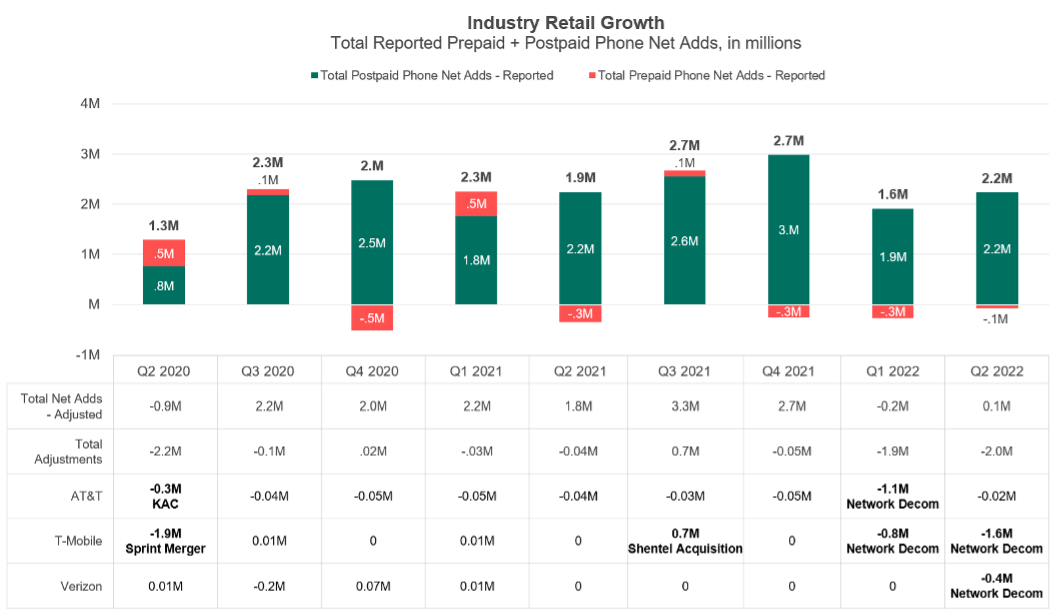
Adjustments are common in the wireless industry. An operator buys another operator, customers switch from prepaid to postpaid or vice-versa, new rules on what it takes to continue to be a customer get implemented – essentially, a cleanup of the subscriber base. These changes are typically in the low hundreds of thousands, important but not earthshattering. With the shutdown of 3G networks, we are entering another period where these changes are significant. No matter what we call these disconnections and whether they are included in the churn statistics or not, they still represent a reduction of subscribers in the industry. These adjustments to what is and is not a subscriber and where that gets counted provide valuable insights into the health of the wireless industry.
In the chart below, we are looking at the overall phone universe and see that the two segments have more overlap than what many people want to acknowledge. The orthodox, adjustment-free view shows us solid growth over the last two years and creates the perception that industry growth exceeds population growth followed by exasperated questions of “Where are they all coming from?”
When we look at the impact of the adjustments, a different view emerges. For example, in Q2 2020 there were two significant adjustments: a clean-up of the Keep America Connected disconnects by AT&T and, more importantly, a large adjustment by T-Mobile as part of the Sprint merger. Sprint had created a bit of a mess ahead of the merger and counted people as customers who might really live up to that moniker. It counted some connected devices as phones, didn’t disconnect people even though they were significantly in arrears, and counted prepaid Boost customers who financed a device as postpaid. As a result, 1.9 million subscribers disappeared from the books. The total subscriber numbers actually show a reduction of 900k subscribers despite an “official” 1.3 million subscriber gain. We saw a similar trend due to the 3G network shutdown at AT&T and T-Mobile. What looked like strong subscriber gain quarters were actually flat quarters due to the disconnects of 1.9 million and 2 million 3G subscribers. We will see further adjustments when Verizon shuts down its 3G later in the year.
The interesting implication of the adjustments and their use to net out the official numbers is that the three mobile network operators did not add subscribers in the first half of 2022. The entire growth of the wireless sector comes from the cable industry in the form of Charter and Comcast.
In 2011, Verizon was in a pickle as it could project when it would run out of spectrum and needed to maintain its strategy of being the network leader in the United States. The deal was straightforward: get spectrum from the cable companies in exchange for an MVNO agreement and hope that the cable companies will be as successful as they were in their previous attempts with Sprint, which is not at all. This premise held up until 2017, when Comcast started offering service, followed shortly thereafter by Charter. The two cable operators went to market by positing that they could offer the best network experience for combined mobile and home internet for roughly the price of a premium wireless subscription. Customers liked the premise, and cable providers have consistently been between a quarter and a third of industry postpaid net adds, taking a healthy bite of the wireless industry growth. Examining Comcast’s and Charter’s total market flow share performance, which includes prepaid and postpaid, it becomes clear that Verizon is coming out ahead. For example, during July 2022, based on our Recon Analytics Data services, only 27% Comcast’s and Charter’s customers have come from Verizon. Tracking Verizon’s revenue components for many years, we estimate that Verizon gets an average of $13.13 from its MVNOs per customer, which include providers like US Mobile, Red Pocket Mobile, Lively, Affinity Cellular to mention only a few. A comparison between Verizon’s $18.35 EBITDA contribution and its $13.13 MVNO revenue per customer, which is almost pure profit, shows that Verizon is coming out significantly ahead. For every Verizon customer that moves to Comcast and Charter, three join the Verizon network from other providers, both postpaid and prepaid. The 661,000 Comcast and Charter net adds in Q2 2022 contributed an incremental $41.4 million in overall annualized revenue. If Verizon would disclose more numbers and be more transparent, it could easily dispel the erroneous notion that its wholesale business is a negative for the overall business when it is clearly not. While Verizon’s branded subscriber base which it reports quarterly is under pressure, its unreported network share is performing substantially better. More people are using the Verizon network today than ever before, and its wholesale partners are an underappreciated part of the story.
The headwinds that Verizon is facing are coming from its two main rivals T-Mobile and AT&T. T-Mobile continues to perform well with a “have your cake and eat it too” positioning by marketing a superior network at a lower price value proposition. Considering that it trails AT&T in postpaid phone net adds, we can only conclude that the message could be resonating better. AT&T is leading the industry with a straight-forward consistent promotion strategy for new and existing customers. The lack of fading-in and fading-out promotions that the two other operators are offering is paying off for AT&T. The new AT&T leadership has transformed the company from being the source of everyone else’s growth to being the fastest growing postpaid phone provider in the United States.
To take the fight back to the cable providers and utilize fallow spectrum, T-Mobile and Verizon have launched fixed wireless internet access to compete against traditional home internet providers. With 2.1 million fixed wireless customers between them, they have captured the buzz of the telecom market. With easy to set up wireless routers, straight forward pricing, and speeds around 100 to 300 Mbps, FWA providers are on top of Recon Analytics’ net promoter score list in every one of the 14 metrics we are tracking. What we see in our FWA flow share analysis is that FWA is currently a threat to every other technology, as it captures many disgruntled home internet subscribers who are looking for a different, attractively priced option. The questions are: How long can this last? and From where geographically do these customers come?
The main constraining factor is the availability of fallow spectrum and the usage profile of home internet users. It is not uncommon that home internet users use 500 to 800 GB per month compared to approximately 15 GB for a mobile user, while paying around less than $50 per month for their subscription. In urban and suburban areas, due to the much higher population density and approximately the same amount of spectrum, the maximum amount of fixed wireless customers before they impact wireless user experience is much more limited than in rural areas. In rural markets, fixed wireless access performance is much more driven by cell site density rather than the availability of spectrum. At the same time, rural America has the problem of being by definition rural, which means not a lot of people live there.
Fixed Wireless Subscriber by Urbanicity
Source: Recon Analytics Data, April to August 2022
Both Verizon and T-Mobile have been a lot more successful in urban and suburban markets than in rural markets, which is both an opportunity and limiting factor at the same time. The much-touted transformation of rural connectivity is still a lot more talk than reality. T-Mobile’s new Home Internet Lite plan demonstrates the strain on the network from unlimited plans. It introduces usage-capped price plans in the name of being customer friendly and allowing to be available everywhere. The positioning will be that not everyone needs unlimited data and with a fixed amount of data rather than unlimited data these customers and it allows T-Mobile to charge a higher price per GB in constraint areas. At the same time, it makes T-Mobile closer to the cable companies it derided in the past that have usage caps. It also proves AT&T’s argument that fixed wireless is not a fiber replacement in many places.
The competitive intensity is greater than ever before and the battle ground is larger than before. The battle for market share in this new converged communications provider world has just begun, with the tides of the battle swinging back and forth.
In case you are just tuning in, Verizon has been going through a rough time for about two years now. In fall 2021, it replaced Ronan Dunne as CEO of Verizon’s Consumer Group (VCG) as it struggled before filling the position with Manon Brouillette. It would be difficult to say that things have improved.
We live in peculiar times. For a long time, financial analysts wanted to convince us that when a mobile network operator (MNO) has a larger size than its competitors, the size advantage gives them a substantial edge in the market. Now, other financial analysts want to convince us that Verizon, because it is the largest provider in the market, is destined to lose customers for the foreseeable future. I disagree with both positions but would point to having a good plan, the ability to rapidly adapt to new circumstances, and superior execution to being the only sustainable competitive advantage in the market.
Verizon has traditionally differentiated itself as the premium provider in the market based on superior network performance. Taking network leadership to heart, Verizon charged ahead in 2G, 3G and 4G and created the fastest and largest network for at least the first three to four years of what is generally a seven-year technology era. The shock and awe of the early, rapid build created a nimbus of permanent network superiority even though, at least in urban markets, by year five, we had network parity. In contrast, in rural markets the network superiority persisted.
For the last decade, Verizon has internally fretted about what it should do if and when this trick would no longer work and its network superiority nimbus would be diminished, or even worse, large swaths of customers would perceive network parity or, even worse, someone else to have the better network.
Several poor decisions and outcomes around spectrum auctions weakened the strong network foundation. Verizon seems to have then tried to replace the internal differentiation of being the provider of the undisputedly best network with having the best streaming bundle and differentiating around that.
Replacing an internally generated differentiation with an externally acquired differentiation, especially when it is so easily replicable, is a dangerous gamble. To make this decision even more puzzling, Verizon engaged in the content-differentiation strategy at the same time when AT&T exited the content bundling with wireless.
AT&T and T-Mobile having seen the 2G, 3G and 4G outcomes decided they didn’t want to live through the same experience with 5G and put a lot more emphasis on network performance. While in Recon Analytics Data weekly net promoter score data, Verizon still leads in the network performance categories, the gap has undoubtedly diminished. Metered speed tests show Verizon being behind, but how much does it matter? In our purchase decision factor ranking, speed is a solid second out of nine metrics.
Especially T-Mobile, powered by Sprint’s spectrum and a greater network focus with various firsts has given Verizon’s network team a run for its money. AT&T has been more judicious in spectrum expenditures and build-out pace betting that speed test results alone don’t win customers and aligning its build-out more with customer and technical capabilities and usage. The slower build-out has not hurt AT&T’s success in the marketplace because it was able to execute on other purchase factors that existing and prospective customers find important.
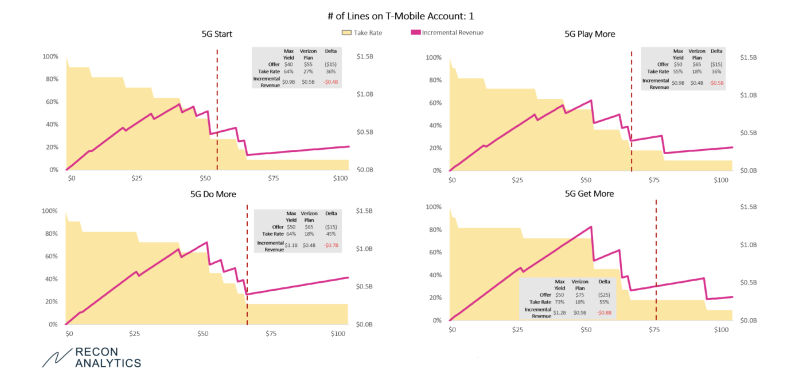
Verizon’s recent promotion
On May 22, 2022, Verizon launched an online promotion where single-line customers would get $15 off, two-line customers $12.50 per line off, and three-line customers got $5 per line off. Since Verizon did not issue a press release around it, it was largely unreported.
We took it as an opportunity to test Verizon’s value proposition of all plans – 5G Start, 5G Play More, 5G Do More, and 5G Get More – against what the customers of the other providers, ranging from T-Mobile and AT&T to Google Fi and Mint Mobile, were willing to pay for the different plans for a different number of lines. This gave our clients one week later a read if they should worry, to what degree, and about what part of Verizon’s promotion they should be worried about.
Below is how just T-Mobile customers were viewing Verizon’s single-line plans and for what price they would switch to the plan. While this is no sophisticated conjoint pricing analysis, it nevertheless gives some interesting insights. It also does not consider larger long-term pricing strategies that a company like Verizon would have to consider when making pricing decisions. The yellow shading represents the take rate at a given price point, while the magenta line represents the revenue that would be realized.
With the promotion, Verizon charged for a single line $55 for 5G Start, $65 for 5G Play More, or 5G Do More, and $75 for 5G Get More. As a reference point, Verizon just launched Welcome Unlimited for $65 for a single line for a skinnier offer than 5G Start.
T-Mobile customers’ highest revenue price point was $40 with a 64% take rate for 5G Start vis-à-vis Verizon’s $55 promotion. 5G Play More and 5G Do More were valued at $50 with 55% and 64% take rates respectively while Verizon was charging $65. Verizon 5G Get More plan discounted to $75 during the promotion was also valued at $50 with a 73% take rate.
Analyzing the data as in the above example vis-à-vis T-Mobile, it became apparent that in the one-line segment, the Verizon promotion would not save Verizon’s quarter. The numbers for the other providers for single-line customers were roughly similar to those of T-Mobile customers.
Interestingly, despite being the least generous, the three-line offer was the most competitive for several of Verizon’s offers. This brings us back to Verizon’s new Welcome Unlimited plan. It looks like a significant uphill battle to convince single-line customers to spend $65 per month when only two months ago, at least T-Mobile customers thought it was only $40 worth.
As I mentioned before, customers of different mobile service providers and for different line counts value Verizon’s plans differently, but in the one- and two-line part of the market a similar picture emerged.
Verizon isn’t suffering from a large size that dooms its progress; it suffers from a value positioning, value perception, and long-term pricing strategy issue.
There is broad agreement in the United States that we need to increase broadband coverage and make broadband more affordable for low income Americans. To arrive to that conclusion, it is unnecessary and actually is counter-productive to use less than reliable data to make this point.
Thomas Philippon recently authored a paper entitled, “How Expensive are U.S. Broadband and Wireless Services.” In it he concludes the American consumers pay more for broadband and wireless services than consumers in other industrialized nations. Unfortunately, these conclusions appear to be based on data that are dated, incorrect, omitted or misinterpreted. The findings are actually a disservice to the goal of closing the digital divide that exists both in coverage and affordability.
Fixed broadband prices
To compare U.S. with European prices, the paper uses data collected by cable.co.uk, an advertising website in the UK that tries to convince UK customers to buy UK broadband services rather than relying on unbiased sources. It is not clear what expertise this company has at determining U.S. broadband prices (or interest in showing them to be economical) and conducting proper apples-to-apples international price comparisons. In particular, there are no data contained within cable.co.uk’s currently provided spreadsheet that allow a reviewer to ascertain that similar quality plans were sampled in each country. Indeed, this seems in doubt as in its most recent study, cable.co.uk reports that the plans it sampled from the U.S. had an average price of $59.99, with a minimum price of $29.99 and a maximum of $299.95. The magnitude of this variation suggests that the sampled plans varied widely in quality (i.e., offered speeds), and it is especially curious that cable.Co.UK’s computed average speed should be $59.99. For an average from 26 observations to arrive at this archetypical retail price number seems improbable.
Indeed, it is highly likely that the quality of broadband services that cable.co.uk compares are quite different. In its current report on prices, cable.co.uk suggests that readers should also examine cable.co.uk’s study of worldwide broadband speeds. It is more than a little revealing that in the provided spreadsheet, cable.co.uk finds U.S. average speeds to be nearly twice as fast as UK speeds (71.20 Mbps vs. 37.82 Mbps). Furthermore, the only listed European countries or dependencies that exceed the U.S. in speed are:
Liechtenstein (population of 38,747)
Jersey (A British crown dependency of population of 107,800)
Andorra (77,142 people)
Gibraltar (a British Overseas Territory with 33,701 people),
Luxembourg (590,667 people)
Iceland (population 356,991),
Switzerland (8.5 million inhabitants),
Monaco (population of 38,964),
Hungary, (9.7 million people)
Netherlands (population of 17.2 million)
Malta, (460,297 inhabitants)
Denmark, (5.7 million people)
Aland Islands, (Swedish-speaking semi-autonomous region of Finland of 27,929 people)
Sweden, (10 million populations)
Slovakia (5.4 million people).
As you can easily see someone tried really hard to increase the count of geographies that have faster speeds than the US by including parts of countries, dependencies, and dutchies into the mix. Nearly all of these are small countries or semi-autonomous regions with populations less than a typical U.S. city or state. It is notable that no European country with a population larger than that of the Netherlands makes the list of countries with faster average services than the U.S. Given that U.S. broadband speeds exceed significantly those in Europe, and the U.S. generally has much lower population densities, higher wages, and thus, significantly higher per-home network deployment costs, it is unremarkable that U.S. prices might exceed European prices as it costs substantially more to deploy these networks.
The scatterplot of cable.co.uk’s collected prices appears to be consistent with 2017 prices reported by the OECD. But four-year-old prices don’t seem terribly apposite to debates about the current price and quality performance of broadband in the U.S. As demonstrated by USTelecom, broadband prices in the U.S. have been dropping significantly over the past six years even as their service quality has increased dramatically.
After noting that “some of the data measures presented above [in the paper about pricing] are a few years old,” the paper turns his concern to USTelecom’s recent report detailing that deployment of advanced networks is further along in the U.S., and subscription to these high speed U.S. networks exceeds European subscription to similar networks. The paper retort to these findings, that derive directly from data and official statistics collected for the U.S. by the FCC, and for Europe by the European Commission (EC)is to reference a 247-slide presentation published on internet that claims that in 2019, 87% percent of people in the U.S. use the internet, but in Western Europe and Northern Europe, the figures are 92% and 95%, respectively.[1]
There are at least two problems with this response. First, even if these data were valid, they focus on geographic subsections.[2] Why not compare these most-developed areas of Europe against U.S. figures strictly for the Northeast or the Pacific Coast? But aside from needing to slice and dice European data in order to adduce a favorable comparison, the biggest problem is that even if Europeans are using the internet, EC DESI data on connectivity show that many are not using it via a fixed broadband connection. This is because the EC finds that only 78% of European households subscribed to fixed broadband in 2019. So it is more than likely that the slide presentation the paper cites to on usage includes people who use the internet via mobile wireless broadband connections, satellite connections and dial-up internet connections, in addition to fixed line broadband connections.[3] In any event, one year earlier, in 2018, 84% of U.S. households had fixed broadband subscriptions – and the U.S. advantage over Europe widens as only 30+ Mbps broadband speeds and 100+ Mbps speeds are considered.
Fixed broadband speeds
The next topic specifically addressed by the paper is fixed broadband connection speeds. For this, the paper refers to slide 52 in the 247-slide presentation. This slide, he says, “shows the US is close to the EU median, and slightly below France, in terms of speed.” The first statement appears to be false, the second is immaterial. Let’s unpack.
The European countries listed (in terms of speed) on the slide are: Romania, Switzerland, France, Sweden, Spain, Denmark, Netherlands, Portugal, Poland, Belgium, Germany, Ireland, U.K., Italy and Austria.[4] The U.S.A. slots between Sweden and Spain. Now even assuming that the paper meant these comparisons to be against European countries rather than EU countries as he states in the paper, the median European country is Portugal – which lies four positions below the U.S. If only EU countries are considered, the median position drops another half slot to be between Portugal and Poland.[5] While the paper may consider the U.S.’ positioning in these lists to be “close” to the median, he could also have noted that the only major EU country ahead of the U.S. was France, with a miniscule (and likely statistically meaningless) speed advantage of 500 Kbps (131.3 Mbps for France versus 130.8 Mbps for the U.S.).
Thus, rather than showing the U.S. to be a laggard in fixed broadband speeds, the paper’s analysis appears to show it significantly in the lead.
Lightning round
ARPU: The paper then claims to look at broadband ARPU for Altice and Comcast in the U.S., and pronounces it significantly above that in France. The validity of his data is highly questionable, though. For example, Philippon claims (without citation) that Altice’s ARPU is $90/month.[6] Reference to Altice’s SEC 10-K report (at p. 3) indicates that its residential broadband ARPU is $70.52, a figure substantially less than Philippon’s unreferenced figure of $90. Further, Altice is a cable company with a very substantial FTTH footprint. It reports that the average speed purchased by its customers exceeds 300 Mbps – over twice the average speed experienced by French customers.
Prices of comparable contracts: A chart is displayed suggesting that prices for triple-play services in the U.S. exceed significantly those in European countries. This statistic is likely meaningless because it is well known that the cost of television services in U.S. triple-plays is vastly above similar charges in Europe. This is due to many factors, including: U.S. bundles typically include many more channels, especially HD channels, than European bundles; fees paid by U.S. triple-play operators to acquire local broadcast channels, sports channels and other cable television networks exceed greatly those paid in Europe. Indeed, in many European countries, local broadcast channels are paid for via television license fees that are paid separately by customers and are not included in their triple-play bills; U.S. bundles also commonly allow the subscriber to watch several simultaneous programs on multiple television sets – in contrast to European bundles that may be restricted to a single TV set stream.
Labor cost adjustment: Here the paper argues that because “wages are about 20% higher in America than in the main EU countries” and “since compensation of employees accounts for half of the value added in private industries, one might expect [U.S.] price to be [only] 10% higher” than in Europe. This analysis is not compelling. Even if these national-level statistics are specifically applicable to the U.S. broadband industry, there is no need for wage differences to account for the entire amount of any putative elevation in U.S. broadband prices over European ones. That is, they are only a contributor. The fact that the U.S. is much less densely populated than Europe and U.S. networks provide much higher speeds and carry much more data per household than European ones are also likely contributors.
Profits and investment: This section contains a mishmash of data that purport to suggest that U.S. capital investment is not impressive. But, the data presented for “Comcast, AT&T, and other Telecom companies,” not an appropriate basis for analysis because many of these companies are diversified into businesses other than broadband. Comcast and AT&T offer television services and own movie studios. Comcast owns theme parks and AT&T owns legacy copper telephone networks and DBS satellite systems. Consolidated capex figures from these companies are inadequate to discern broadband-specific investments.
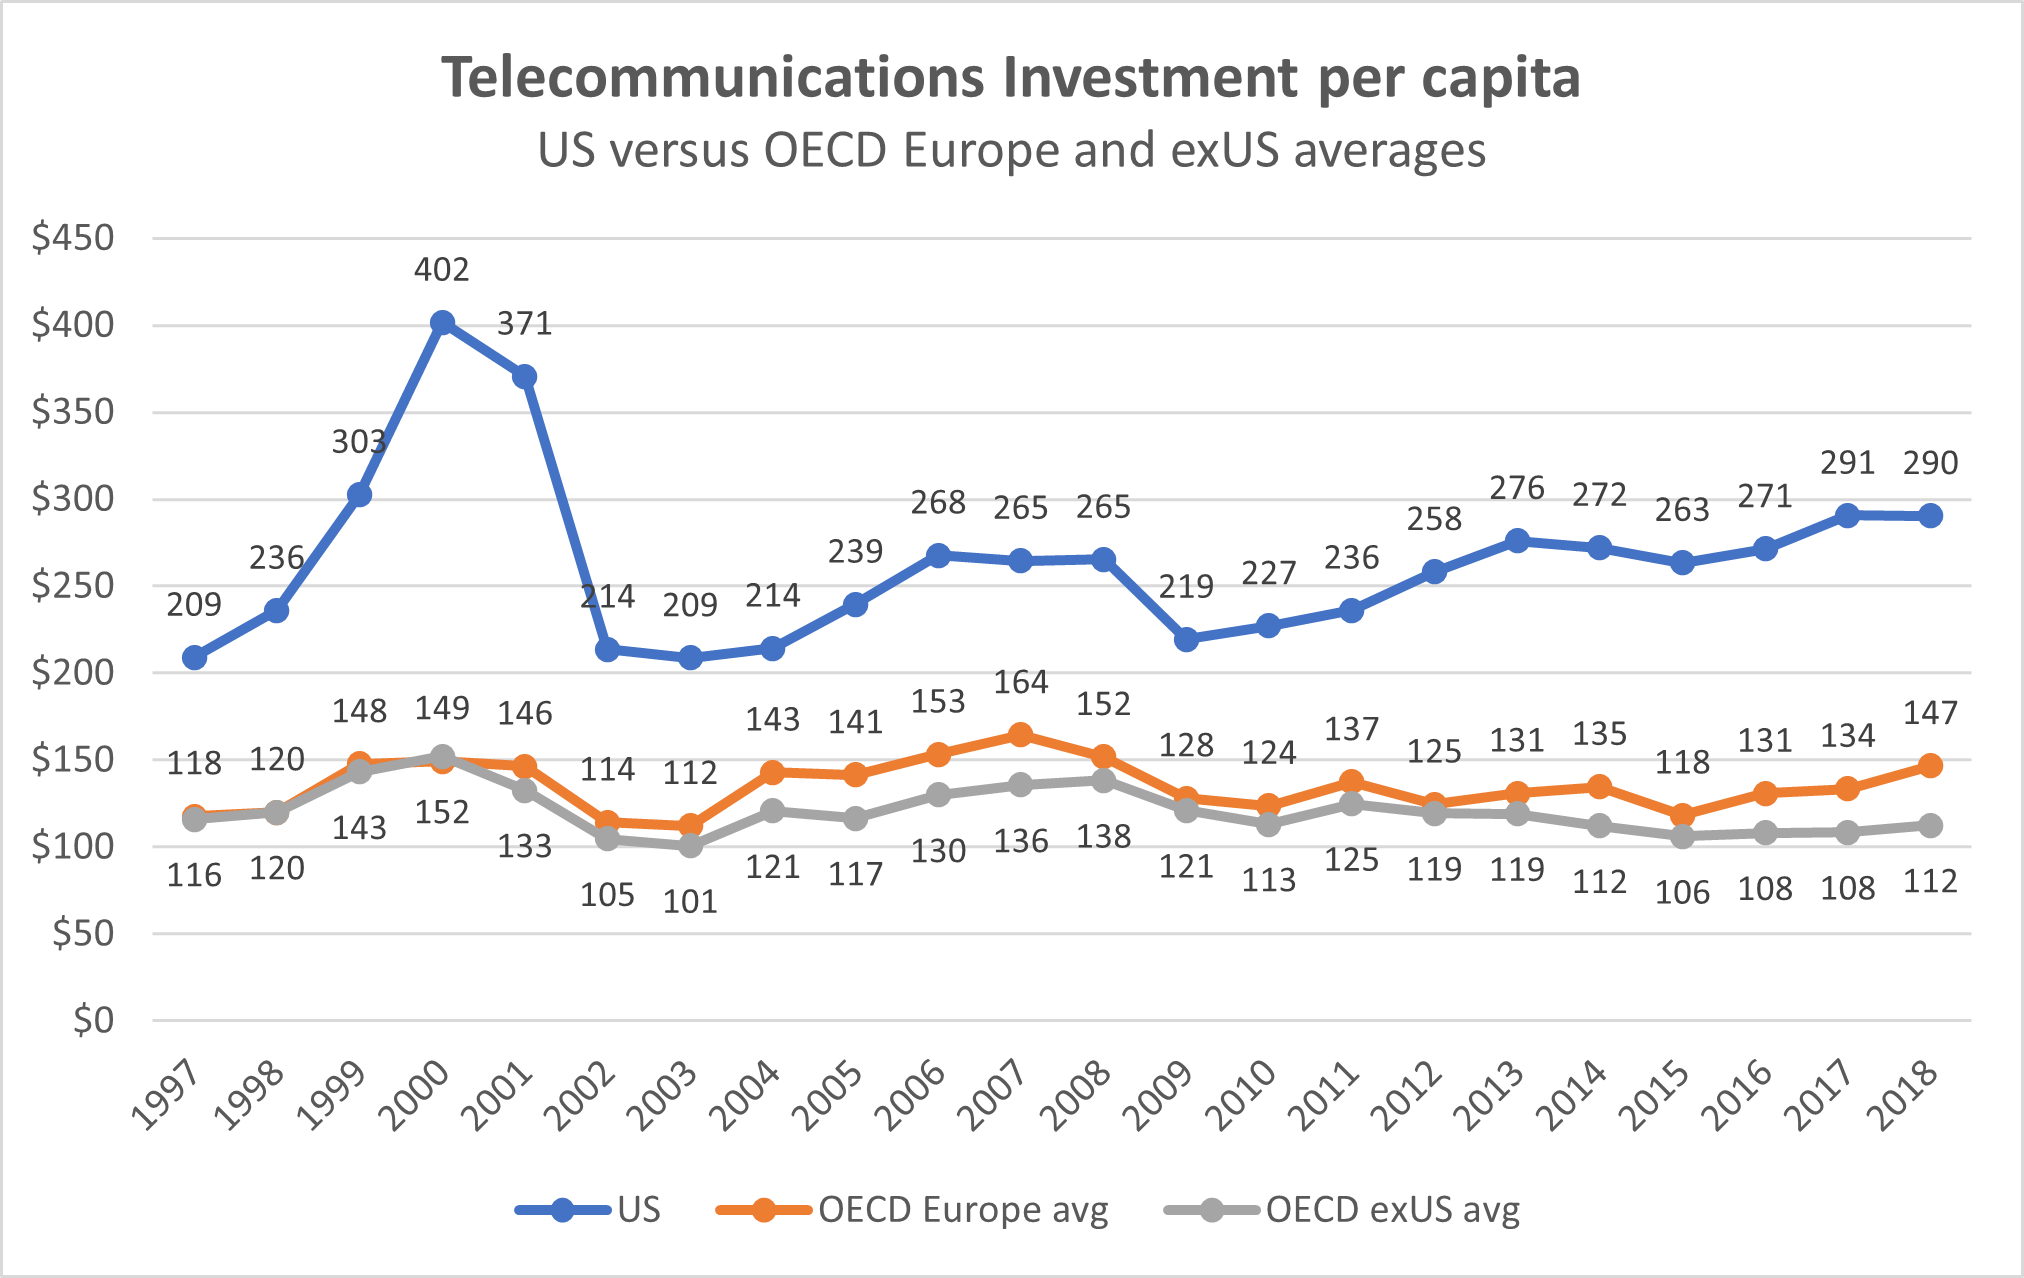
But in any event, discussion of the above is probably intended to divert attention away from the best available investment comparator for telecommunications, the data collected by the OECD from national statistical agencies or regulators.[7]
All that the paper appears to say in response to the investment history presented in above chart is to note that since 2015, “investment by the main Telecom operators in Europe has grown rather quickly.” So it has; but so has investment grown in the U.S. – and U.S. per capita investment levels remain at nearly twice those in Europe.
Coda
It is odd that the paper should resort to such a strange mix of data that are old, wrong, or misinterpreted to try to support his claim that U.S. broadband is too expensive, and that this can only be the result of a lack of competition. Only by ignoring the fact that broadband networks are more widely deployed in the U.S. than in Europe, offer higher speeds, carry more data, and are more heavily subscribed to can the paper conclude that the European model is to be preferred. But while that may be the paper’s conclusion, it is not that of the European Commission which has studied these issues directly. In Table 7 of Annex 3 in its International Digital Economy and Society Index specifically for connectivity finds the U.S. to score higher than all but the top EU country (Denmark) and to tie in score with the next two highest EU countries (Finland and Malta).[8] All other EU countries score lower.
So the real truth is that U.S. fixed broadband leads, and does not lag Europe’s performance. This does not take away that there are Americans that cannot get broadband internet or cannot afford broadband. We need to help these people and do not need to trump up the differences to come to that conclusion.
[1] Curiously, the paper ascribes his data source’s stated figure of 87% usage for North America to be the usage figure specific to the U.S. This, of course, neglects the fact that roughly 10% of North America’s inhabitants are Canadians.
[2] The sources cited for this agglomeration of statistics (slide 34 of 247) are not traceable. They include: ITU, Global Web Index, GSMA Intelligence, Eurostat, Social Media Platforms’ Self-Service Advertising Tools, Local Government Bodies and Regulatory Authorities, APJ۩, and United Nations. Indeed, this same boilerplate list of sources appears on several other slides in the presentation.
[4] Turkey (which is below Austria in speed) is possibly another European country on the slide, but out of conservatism, we will not include it in our analysis.
[5] The EU countries contained in the slide’s list are: Romania, France, Sweden, Spain, Denmark, Netherlands, Portugal, Poland, Belgium, Germany, Ireland, U.K., Italy and Austria. Switzerland in not an EU country. Note that the U.K. was still a member of the EU when these data were collected.
[6] We assume this is intended to be residential ARPU because the paper compares it against a French statistic for residential broadband prices.
Americans overwhelmingly support that broadband should be available to every American and that the funding base to achieve that should be broadened to every company that makes money through the internet.
More than 78% of respondents agreed that broadband internet should be available to every American showing broad support from large parts of the population. When looking a bit closer at the answers given by respondents who say they have broadband versus the people who said they didn’t have broadband, the support of those respondents who do not have what they consider broadband (26%) for everyone having access to broadband drops to 64%. This indicates that there is not only an availability and affordability gap but also an educational gap. Many people who don’t have broadband internet access either do not want it or do not understand why they should have it. These findings, which are mirrored in other studies, indicate that any broadband infrastructure program should include an educational component to increase the number of broadband subscribers. Otherwise, broadband penetration will never reach its full potential.
As we found in previous surveys on the topic, around 54% of respondents use the internet for work purposes from home. This is equal to the number of employees that are classified as white-collar employees by the U.S. Department of Labor. This number highlights the importance of broadband for the functioning of American businesses and enterprises during the continuing pandemic. It is likely that the added agility and flexibility to work from home will continue to be utilized after the country has emerged from the pandemic restrictions. We also found similar opinions around what Americans consider broadband. The median American considers 50/5 MBits as broadband whereas the most answered response was Gigabit speed with 29% of respondents.
The high percentage of Americans who think broadband should be available to everyone is probably based on the intensive usage and the need of many Americans to use it from home to work. Using the weighted average of the responses, Americans spend around six hours every day on the internet.
How many hours do you spend on the internet with a mobile device or computer?
Use the internet from home for work
Does not use the internet from home for work
Combined Response
Less than an hour
4.8%
18.0%
10.9%
Two to four hours
18.1%
36.0%
26.4%
Four to six hours
15.2%
26.3%
20.4%
Six to eight hours
25.2%
8.8%
17.6%
Eight to twelve hours
25.7%
4.8%
16.0%
More than twelve hours
11.0%
6.0%
8.7%
When looking at those who also use the internet from to work from home, unsurprisingly the usage pattern is significantly heavier as their usage pattern includes both business and leisure activities.
While only 37% of respondents knew that the Lifeline Program provides low-income Americans with basic phone and internet service, they were open to new funding sources to close the digital divide. More than 71% of Americans are in favor that companies with business models that rely solely on the internet to exist and who also generate revenue from those businesses, like Google and Facebook, also contributing to provide access to Americans who currently do not have access to the internet. Such a move would dramatically expand the funding sources for a broadband access plan and include companies that have exerted the most valuable and profits from the internet.
What is really interesting, the survey also found support to extend net neutrality rules to websites and ecommerce companies. We framed questions around the net neutrality principles of no blocking, no throttling speeds, and no paid prioritization by asking Americans if websites like Google, Facebook or Amazon should be allowed to restrict access to legal sites, give preference to their own products and services over others and change the search results based on how much money they receive from others.
More than 72% of Americans are against companies like Facebook or Google restricting access to legal sites for any reason. This is exactly the behavior that Facebook showed when it made it impossible to link from Facebook to news sites in Australia (and for a short time to itself) to avoid having to compensate news sites linked to. In essence, it was a commercial and legislative conflict where Facebook wanted to use its customer base as a bargaining chip in its negotiations. This is the essence of the “No Blocking” rule in net neutrality.
More than 55% of Americans believe companies like Amazon, Google, or Facebook should not be allowed to give preference to their own products and services over that of others, a self-dealing practice that has cost Google more than $10 billion in fines by the European Union. Search engines like Amazon, Google, and Facebook, all of which provide you with what you are looking for, are increasingly the prism through which we see the world. They have incredible power over our perception of what it is we are actually looking for. By pushing competing products into the obscurity of lower-ranked results, they, in essence, throttle the success of other products that are better but do not fit the commercial objective of the search engine provider.
In terms of pay-to-play result manipulation, more than 80% of Americans say they are against search engines altering results based on how much websites and advertisers pay for preferential positioning. It is common that the first view search results for a given term are occupied by responses that are marked by the easily missed word “Ad” in front of the link. This effectively operates as paid prioritization, something the ISPs are not allowed to do under California’s net neutrality law, nor under earlier versions of net neutrality that the Democrats might be considering reinstating.
The results of our survey showcase two key points: Americans are open to reigning in tech giants, who solely rely on the internet to generate revenue, and curbing their ongoing uncompetitive behavior, and having these companies contribute part of said revenues to subsidize access to broadband for low-income Americans. While the Biden Administration focuses on proposing ideas that have been tried and tested, perhaps it should take a step back and listen to consumers, who are those who the administration ought to serve and prioritize.
While we all agree that the United States needs more broadband and net neutrality, most Americans do not support the Biden administration’s plan. The majority of Americans want internet companies to pay their share to build the broadband network that these companies are profiting from. They also want to be protected from the demonstrated behavior of internet-based companies that violate the net neutrality rules that these companies want to impose on other companies but not themselves. Net neutrality rules need to protect consumers and not one set of companies that want to prevent other companies to effectively compete with them. Any net neutrality rules that do not apply to internet service providers and internet companies like search engines, social media companies, and e-commerce providers is just cleverly disguised corporate welfare with the government picking winners and losers.
Between March 16 and March 26, 2021, Recon Analytics conducted a demographically representative survey of 1,000 Americans using the internet and cell phones, asking them about their opinions and attitudes around universal access, funding mechanisms, conduct, and usage.
Do you believe that access to broadband internet should be available to every American?
Yes 78.2% No 21.8%
Did you know that the government requires a small portion of your phone bill to be used to fund phone service for low-income Americans aka lifeline service?
No 62.9% Yes 37.1%
Do you think companies like Google and Facebook that make money through the internet should contribute to the provide access for Americans who do not have the internet?
Yes 71.4% No 28.6%
Should companies like Google or Facebook be allowed to restrict access to legal sites for any reason?
No 72.7% Yes 27.3%
Should companies like Amazon, Google, or Facebook be allowed to give preference to their own products and services?
No 55.8% Yes 44.2%
Should search engines be allowed to alter search results based on how much money they receive from websites or advertisers?
No 80.6% Yes 19.4%
How would you define broadband internet access?
3/1 9.3% 10/1 9%
25/3 14.8% 50/5 17.3%
100/10 20.9% Gigabit 28.8%
Do you currently have broadband internet access?
Yes 74.2% No 25.8%
Does your job require internet access at home?
Yes 53.4% No 46.6%
How much time per day do you spend on the internet (via your mobile device or on your computer?)
With the advent of 5G and, with it, a technology called network slicing, many parties, ranging from mobile network operators and enterprises to policymakers, are re-examining how to deploy customized networks that were previously unfeasible. The flexibility afforded by network slicing will allow wireless operators to more efficiently meet the needs of their enterprise customers, particularly those customers concerned about the potential costs or burdens of “do-it-yourself” or outsourced private networks. Alternatively enterprises may choose to deploy a private wireless network to meet their needs. This would require a specific plan to utilize spectrum they obtain or lease from another entity along with a private network managed by an operator, network supplier, or viable third party.
Network slicing allows a network operator using the same physical wireless network to provide virtual slices with different characteristics to serve different customer needs. It allows the operator to tailor the technical characteristics such as bandwidth, latency, and security for certain types of applications. This is especially significant for enterprise customers whose desire to enjoy the economic benefits associated with large-scale network operators; instead of defaulting to largely homogenized offerings, companies and operators now enjoy unprecedented flexibility to develop customized solutions at a much lower cost.
Flexibility comes from the move towards virtualization and software-defined networking, where network infrastructure that was an integrated software and hardware component becomes disaggregated into a software program running on general purpose computers and servers.
Cost savings come from the shared use of physical infrastructure when the new specialized tasks only require the installation of a new software application solving, the enterprise’s specific need.
The enhanced capabilities and cost savings allow enterprises to switch from a production process that has been hardwired to a flexible wireless approach, just as mobile phones have replaced landline phones as the preferred way to communicate. In particular, the development of network slicing allows providers and customers throughout the wireless ecosystem to continue to enjoy the efficiencies of flexible use licenses and larger geographic license sizes, while also benefitting from small-scale customization.
5G Network Slicing
Over the last five years, the concepts of software defined networking (SDN) and network function virtualization (NFV) have taken large strides in the telecom world. The change from application-specific hardware to networks that are built on a general-purpose computing foundation, implemented and orchestrated by software, is a watershed event. The typical wireless network of 2015 consisted of roughly 30,000 to 50,000 different pieces of hardware with integrated software. The hardware elements (also called SKU for Stock Keeping Units) included base stations, internet routers, messaging gateways, multimedia gateways, switches and many other components. For every function in the network, one new SKU was created. These SKUs are highly efficient at running the specific task for which they are designed as long as they are close to being fully utilized. The networks are also designed around the busiest time of the day for the specific function, plus a significant margin for growth so that customers can always use any function they might want to at any time of the day. Usage is highly variable both over time and across functions which are being used, leading to a significant amount of idle capacity and significant cost.
As MNOs have transformed their networks from hardware-centric to software-centric, wireless networks have become a lot more flexible. By being able to use each network function as an application, these developments have allowed MNOs to create network slices that provide service assurance by creating virtual wireless networks as part of the overall wireless network.
The key advantages of network slicing are:
Enhanced mobile broadband. It allows the operator to guarantee reliable, ultra-high speed data connections for applications such as live 4k video streams.
Very low latency. It makes applications such drone flying beyond visual range possible and among other things opens up the ability to inspect power lines and buildings.
Massive IoT. Thousands of IoT devices such as sensors can be installed per square mile allowing for a range of applications such extremely even temperature control on a shop floor where material variances are measured in mu requiring temperatures to be within one degree for product uniformity.
Importantly, these key advantages can be mixed and matched to suit different industry verticals, all over the same physical network.
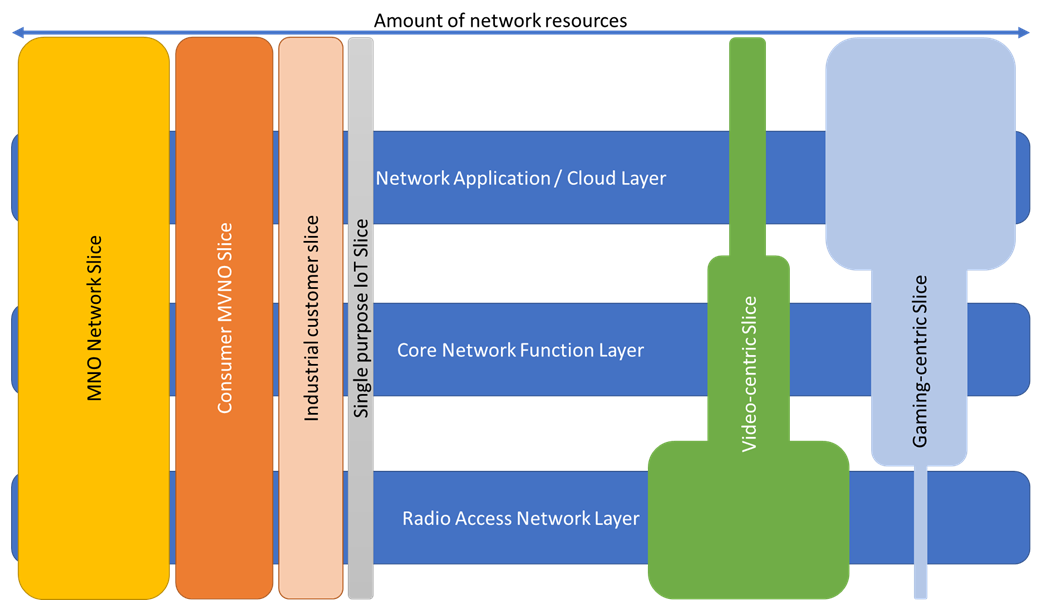
Below in Exhibit 1, we have abstracted the network into three layers: The radio access network (RAN) layer, which is responsible for the wireless connectivity between the device and the network; the core network function layer (core) that controls how voice calls and data sessions are connected; and the network application layer on which the various services run. The network application layer consists of either a private or public cloud, centralized or at the edge of the network. This way, a specific amount of resources can be allocated to every network task. In the exhibit, the width of the bars is the amount of resources guaranteed to each slice. The MNO can thereby guarantee all customers who have bought a network slice a minimum performance through a service level agreement (SLA.)
For example, the MNO has set aside a specific amount of network resources for its retail or consumer customers (the MNO Network Slice). Since its customers are using a balanced number of applications, it needs a corresponding amount of core and RAN resources to serve all of its customers, both consumers and enterprise customers, well. The MNO is also hosting an MVNO which is smaller than the MNO and has therefore purchased fewer network resources that are also balanced. The same with a large industrial provider and an IoT provider who have created their own private networks by acquiring smaller slices of the network. On the right side of the exhibit are two examples that show the strength of the network slicing model. In the green case, a customer purchases a video-centric slice, either for internal use like a large close circuit video network or a company providing video services to its customers. Video is the RAN killer app, both in terms of popularity and in terms of RAN resources needed. For that reason, the company purchases a significant amount of RAN resources. At the same time, a single use needs less core resources and even fewer resources at the network application layer, may it be in the form of a private, public or mobile edge cloud, as it streams the video. A contrasting example would be a game-centric slice. Multi-player online games are not data intensive, using only a small fraction of the data bandwidth that a video stream uses, but are highly latency dependent. To ensure the required latency, gaming demands a service with a higher amount of core resources and an even higher amount of network application resources where the processor-intensive calculation takes place.
Exhibit 1:
Source: Recon Analytics, 2021
Network slicing allows MNO administrators to custom tailor which resources are needed to deliver the services that the customer wants and needs by guaranteeing their availability at the network level.
Building a wireless network involves a significant amount of investment regardless of whether the network serves one customer or one hundred million customers. Building a RAN with towers, antennas and radio heads, a core network and application network layer with servers is a significant undertaking, even for established MNOs. Network slicing allows non-telecom companies to have the benefits of a private, secure, custom-tailored network meeting their needs without having to build, manage, maintain and upgrade it themselves. It is the difference between building your own car and leasing a car to drive to work every day.
Telecom engineers were determined to discover better ways to run a network than with 50,000 individual components. Using data centers and even personal computers as an example, they posited that it would be more efficient, flexible and agile to virtualize network functions (NFV), turning the vast majority of SKUs into computer programs and using general purpose computers or servers to create what is known as software-defined networking (SDN). This solves various issues:
Agility: With an SDN it is much easier to launch new products and services. Instead of having to justify the cost and complexity of having to add another SKU to the network, mobile network operators (MNOs) can simply launch the service by starting the software program. Adding a new service becomes (almost) as easy as installing a new browser or word processor on a PC. If the service is successful, it takes up more data center resources, using excess capacity of a service that has fallen out of favor. If wildly successful, the MNO can simply add more servers. If the service fails to catch on, the application either uses minimal network resources or is deleted. Thus there is no need to pay for, install, and potentially remove hardware from the network.
Reduction in network complexity and cost: As mentioned before, an average mobile network has 30,000 to 50,000 different SKUs performing different network functions. The fully virtualized SDNs that are operational today have reduced that number to six.. Fewer network elements means less complicated and expensive maintenance and purchasing costs as well as fewer hardware incompatibilities that need to be overcome. With fewer network elements, fewer people are needed to operate the network, thereby lowering operating costs. Since the network runs on a large number of commoditized servers that are interchangeable, costs are lower due to larger purchase volumes of generally available commoditized hardware.
Speed and scale of innovation: By using standardized, general purpose server hardware, wireless networks are joining the larger and faster speed of innovation rather than continuing to rely on the speed of innovation in niche applications. Furthermore, by shifting innovation to the software layer, many more companies can develop new software than what would be possible in an integrated hardware and software model.
Security and vendor independence: By using standardized hardware to run the network, it becomes less likely that malware gets introduced to the network through compromised hardware as the removal of compromised hardware is expensive and time consuming. If any software is compromised, it can quickly and inexpensively be replaced by a competing product. Furthermore, by relying on software over standardized hardware, MNOs can much more easily switch from one vendor to another for technical or commercial reasons.
Ease of management: In an SDN, all virtualized network functions can be controlled and changed from one platform and one location. In a traditional wireless network, individual network elements have to be individually changed and monitored, often with different applications that do not work together, and the changes have to be made locally. Most importantly, when network software runs on standardized hardware, it is possible to allocate specific resources to predetermined tasks, something that is called network slicing.
Until now, enterprise customers whose operations were dependent on features like these were incented to build and operate (or outsource) their own customized networks, entailing significant capital and operational expenses since this approach would not incorporate the efficiencies passed through to customers by large-scale traditional mobile network operators. Network slicing now allows enterprise customers to share in those efficiencies of scale, while still gaining the advantages of network customization – the best of both worlds.
Network Slicing Use Cases
5G network slicing allows guaranteed network performance that was not possible in 4G. This allows mobile network operators to offer a whole new set of capabilities that were previously not possible.
Industrial use case
5G is ideal for factories as it removes the need to lay cables to run different machineries that cost in the hundreds of thousands of dollars depending on the size of the factory floor. Network slicing, with its guaranteed performance, allows factories to connect precision machinery that needs to react to changes in the production process with less than 10 millisecond reaction time, like metal works or chemical processes. It also allows the production process flow on the shop floor to be changed according to new and different tasks without incurring cost prohibitive expenses and time of rewiring the shop floor. In addition, the material flow on the shop floor can be automated and, with below 10 millisecond reaction time, centrally controlled. Work-in-progress material vehicles can shuttle material from work station to station. By shifting the work-in-progress material flow from manual labor to an automated process, the number of work-related accidents on the shop floor can be significantly reduced, improving employee health and decreasing work related healthcare costs.
Just like in the hospital use case, the industrial company can choose which elements and functions it wants to source from the mobile network operator and which parts it wants to own itself for maximum flexibility. For example, in an automobile manufacturing plant, the automobile manufacturer installs its own antenna network, uses its own industrial applications to run the robots and manufacturing street, but relies on the mobile network operator to integrate it and run it on the mobile operator core.
Drones beyond visual line of sight
One of the advantages of 5G and network slicing is the guaranteed low latency and high data through put. What has been an exclusive purview of the military, is coming to the civilian sector: Flying drones beyond the visual line of sight (BVLOS.) The FAA approved BVLOS flights for public safety in August 2020, with a commercial application approved in January 2021. Due to the reaction time limits by traditional technology the drone cannot be further away that 1,500 feet from the pilot and more than 50 feet above or within 400 feet horizontally of any obstacle. The 5G and network slicing operators can guarantee a stable connection and low latencies that will allow drones to fly wherever there is a network connection and much closer to buildings, cables, and anything else the FAA describes as obstacles. Powerlines, local and long-distances, as well as cell cites need to be visually inspected in regular intervals to ensure the structural integrity of the units is still warranted. Currently, a lot of these inspections are done either by car or on foot with binoculars or personnel has to climb up the structure to inspect it. Due to OSHA regulations, they have to be turn off to be inspected, which impacts customers. When the industry switches to BVLOS one drone pilot can inspect these structures from a central location leading to lower cost and improved inspections as the drone will deliver a 4k video stream that is then recorded. Successive videos of the same structures can be compared against previous recordings to evaluate how quickly the structure is withstanding environmental impacts and aging. This will allow for preventive maintenance reducing cost and uptime. For the public safety community, BVLOS provides the opportunity for firefighters to have a better view on forrest fires than what is possible with planes. Drones can fly closer and slower to the ground than planes or helicopters, without endangering a pilot, giving firefighters a better understanding of conditions before they fight the fire in person. Futhermore, use of augmented reality (AR) and virtual reality (VR) technology can aid flying the drones and better help with inspecting various pieces of equipment.
Augmented and virtual reality use case
Combining 5G with network slicing allows reliable and predictable performance of augmented and virtual reality applications. For example, television programs can use 5G to holographically capture interviews and events, transmit them to a TV studio, and project the live images, allowing people in the studio to interact with the holographic images. Examples of this include interviews from sports events where the athletes are projected straight into the studio to be interviewed. Network slicing is particularly useful for large, highly latency-sensitive data streams for multimedia applications, since it allows for the dedication of bandwidth and computational resources needed to ensure flawless delivery.
Secure banking use case
Mobile payment and banking applications that are currently operating on the common network can be enhanced by creating a network slice that is dedicated only to a bank or payment system’s dedicated network slice. This allows a complete separation of the payment and banking app from the commonly shared wireless network, allowing for greater security and flexibility.
International examples
The advent of network slicing increases the efficiency and attractiveness of larger geographic license sizes. Internationally, the most prevalent way spectrum is licensed is through nationwide licenses. Some large countries like Canada and Brazil follow the US model of splitting the country into a number of licenses. In particular, Canada with regional telecom providers has a similar system for the same reasons as the United States, namely to allow regional providers an opportunity to participate in the wireless market place.
With the advent of 5G, several European countries have set aside spectrum for Industry 4.0 companies in the 3.7 GHz to 3.8 GHz band. Despite its moniker, the licenses are available for all companies at costs that are in the thousands of dollars per year. One of the leading examples is Germany, with its significant manufacturing sector. The German government lays out four scenarios[1] of how German companies can get use a 5G campus network, ranging from a slice of a public network, a hybrid-shared RAN where the public RAN is supplemented with private small cells, a hybrid RAN with a private core, and a fully separate stand-alone network.
The premise of this approach is that allocating spectrum in smaller parcels to individual companies would be more efficient than allocating larger flexible use licenses to MNOs, but experience has not borne this out as the uptake has been limited and is projected to continue to be minor. The first companies that have made announcements on starting 5G private networks are either stand-alone networks or network slices, but almost all of them are being built together with an MNO, either as the provider of a slice or as the lead partner to the customer. For example, General Motors and Honeywell have a 5G indoor system deployed in the United States with Verizon[2]. In Germany, Lufthansa together with Vodafone has launched a stand-alone private 5G network[3] and OSRAM together with Deutsche Telekom has launched a hybrid slice network[4]. In the UK, Ford together with Vodafone[5] and Air France and Groupe ADP are planning a 5G network[6], and in China multiple companies are building or have already built 5G networks with China Mobile, China Telecom and China Unicom respectively[7].
Bitkom, the 2,700-member German industry association for the digital sector, conducted a survey of companies regarding their plans for 5G[8]. Half of all companies considered 5G an important factor for their company in the future. Thirty-six percent of companies are planning or discussing using a network slice from an MNO for their 5G needs and six percent are planning to use the 100 MHz license that the German government has set aside for private company networks. As one of the leading high-tech manufacturing countries in the world, the survey result showing that only six percent of German companies are interested in deploying a private 5G network, where the enterprise owns the radios, network core and applications, on dedicated spectrum is sobering. The advent of network slicing allows enterprises to avoid taking on those responsibilities while still enjoying the benefits of customization.
Opportunity cost of different license area sizes or licensing schemes
Exhibit 2: Industrial locations in Germany with more than 1,000 employees
Private networks, like the industrial networks envisioned in Germany, still require network design, someone who builds the network, operates it and maintains it. This is a challenge for even the largest industry providers. As a result, they are either looking to either large system integrators or mobile operators to provide these services.
An additional challenge is the relatively small license areas for these networks. The smaller the license area, the more challenging network design becomes. In the low- and mid-band, radio waves inevitably will travel further than the smallest, city-block-size census blocks in major metropolitan markets. This creates interference issues with neighboring antennas, especially if they are owned by a different licensee. The interference issue gets smaller with higher frequency spectrum as the signal is increasingly attenuated and has problems penetrating walls.
Another issue to consider is that if only a small number of companies are willing or eligible to use the spectrum, the unused spectrum lays fallow and cannot be used otherwise. This is particularly a problem for low and mid-band spectrum that would otherwise be deployed in wider areas.
Even in a country as large as Germany, with twice as many people than California on half the geography, larger businesses with more than 1,000 employees are highly concentrated as we can see in Exhibit 2[9]. In large swaths of Germany, 100 MHz of 5G spectrum that is reserved for companies will lie fallow as indicated by the large area of grey land and cannot be used for important tasks such as wireless broadband solutions to the home or businesses. This runs counter to the idea that MNOs in both urban and especially rural areas can solve connectivity issues driven by inadequate landline solutions. Network slicing by MNOs allows enterprise customers to avoid the inefficiencies of small license sizes, while still achieving the customization benefits of private networks,
Conclusion
5G and Network slicing are opening up new opportunities for consumers and businesses alike. It terms of added flexibility network sliceing is the best thing that happened to mobile networks since sliced bread. 5G, SND and network slicing eliminate the delineation between telecom and information technology and create a contiguous development space for software engineers. As software is eating the world, this includes wireless networks, just as wireless is eating the world as well. This development opens up new opportunities ranging from augmented and virtual reality to drones to more fully optimized factories.
The cost savings from replacing expensive cabling to reducing workplace accidents are significant as wireless connections replace wired connections. The increased flexibility of changing the workflow on a factory floor is substantial. The ability to fly drones beyond the line of sight will simplify many tasks requiring people on the ground to inspect structures. Considering that the core competency of regular companies is their specific focus and not that of running IT systems or even highly sophisticated 5G networks on a limited scale, the deployment scenarios we see in Germany and other European companies will be that of network slicing or a hybrid solution that MNOs will manage. While it is a possibility that we will see stand-alone networks, the trend in corporate support functions is towards outsourcing as it often provides a better solution at a lower cost.
Most companies have outsourced their entire IT segment to specialist companies that can provide a superior experience for a lower cost. Even email, a relatively simple application, has become a hosted solution provided by large IT companies. Network slicing allows for custom network applications previously deployed on private networks or not at all by essentially creating a network as a service approach, where connectivity is just one of the components of an enterprise solution. Network innovations that would take a separate investment in a private network come when using a network slice as the overall MNO network is being upgraded. By working with an MNO and using a network slice allows companies to benefit from technical innovation for free as the MNO will upgrade their network to remain competitive. As a stand-alone network the enterprise would have to bear the cost for it. Private networks are also an option, but each enterprise should consider the requirements to develop and manage such a network – from spectrum, to design, development, and ongoing operations.
Network slicing allows enterprises to have all the benefits of customized private networks without having to build, operate and keep current the network increasingly becoming essential to remain competitive.
This paper has been commissioned by CTIA – The Wireless Industry Association