Apple gained 6.3 points in installed-base share among 18-to-29-year-old US smartphone users from Q3 2025 to Q1 2026. Exclusive loyalty in the same cohort is 12.3 percent, 23 points below the 60-plus reading.
In the US smartphone installed base, Apple commands the 18-to-29 cohort at 73.7 percent share across the combined Q3 2025 to Q1 2026 window, more than three times Samsung’s combined 19.5 percent. Behind that combined reading, the trend is also moving in Apple’s favor. Apple’s 18-to-29 share rose from 68.9 percent in Q3 2025 to 75.2 percent in Q1 2026, a 6.3-point gain in nine months that is well above the margin of error.
| Quarter | Apple Share | Samsung Flagship Share |
|---|---|---|
| Q3 2025 | 68.9% | 11.3% |
| Q4 2025 | 76.3% | 7.9% |
| Q1 2026 | 75.2% | 9.1% |
| Combined | 73.7% | 9.3% |
The data come from Recon Analytics’ Consumer Pulse Survey, covering 248,279 US smartphone respondents tracked from Q3 2025 through Q1 2026, with respondents’ device brand and model identified via passive detection at survey entry rather than self-report. Apple’s installed base is 93.2 percent in the premium tier and 6.8 percent in the value tier. Samsung’s installed base splits roughly 50-50 between Samsung Flagship and Samsung Non-Flagship.
The age-cohort gap closes sharply by 45-plus and then reverses. Samsung’s combined book reaches 44.7 percent of the 45-to-60 cohort and 44.1 percent of the 60-plus cohort, its highest installed-base concentrations across the four cohorts tracked. Apple’s combined share in those same cohorts falls to 40.2 percent and 42.6 percent. At the brand-total level, Samsung’s installed base exceeds Apple’s at 45-plus, an inversion of the 18-to-29 reading.
Chart 1: US Smartphone Installed-Base Share by Age Cohort
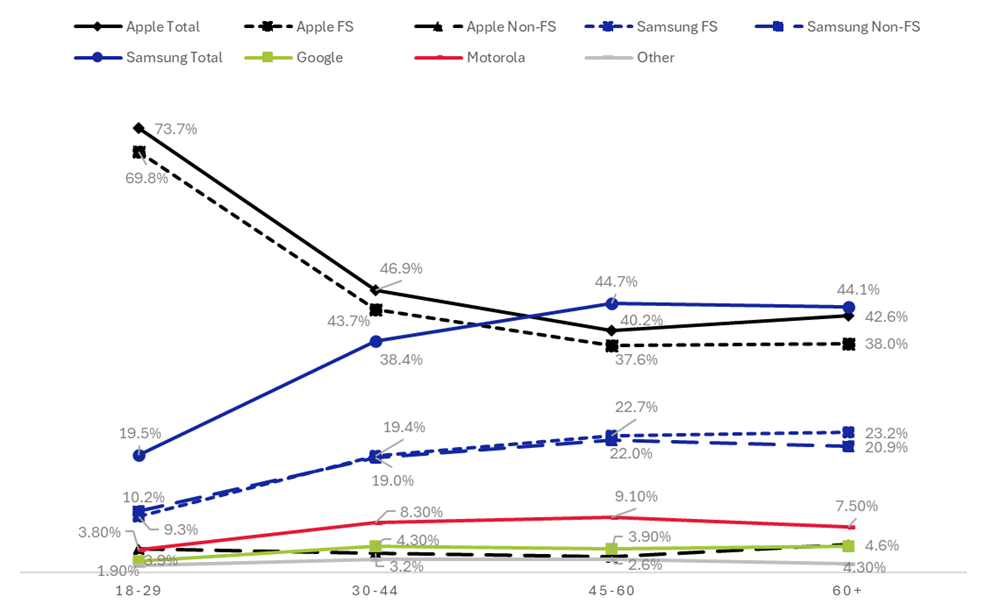
Inside the comparable premium tier, the gap compresses even more sharply than the brand-level numbers indicate. Apple Flagship leads Samsung Flagship across all age cohorts. In the 18-to-29 cohort, Apple’s flagship installed-base share is 69.8 percent, compared with Samsung’s 9.3 percent, a 60.5-point gap. By the 60-plus cohort, Apple Flagship is 38 percent compared with Samsung Flagship at 23.2 percent, a 14.8-point gap. The Apple Flagship lead in the youngest cohort is more than four times that in the oldest cohort. The premium tier is closely contested at 45-plus in a way the youth-cohort dominance does not predict.
When Samsung’s combined installed base is plotted against Apple’s, Samsung Total runs 4.5 points above Apple in the 45-to-60 cohort and 1.5 points above in the 60-plus cohort. That convergence reflects portfolio coverage rather than head-to-head premium competition. Samsung addresses every price band in the US smartphone market, from sub-200-dollar Galaxy A devices to the 1,900-dollar Z Fold. Apple addresses only the premium tier, with a value-tier presence at the SE and 16e price points that does not extend below $599. The combined-book comparison sums two different addressable markets. Inside the comparable premium tier, no cohort crossover exists.
Within the same nine-month window, the premium-tier picture varies across cohorts. Apple’s lead over Samsung Flagship in the 18-to-29 cohort widened from 57.6 to 66 percentage points across the window, the most decisive premium-tier movement in the dataset. In the 45-to-60 cohort, the same lead narrowed from 16.7 to 15 percentage points. In the 60-plus cohort, the compression was sharper: from 19.4 to 16 points. The premium tier is sorted by generation. Apple is consolidating among young buyers; Samsung’s flagship is gaining ground among older buyers.
The combined Q3 2025 to Q1 2026 window includes the iPhone 17 launch quarter (Q4 2025), which produced a sharp Apple gain across all cohorts, partially reverting in Q1 2026. The within-window quarterly cuts isolate that effect: Apple’s 18-to-29 share peaked at 76.3 percent in Q4 2025, then settled at 75.2 percent in Q1 2026. The Q1 2026 reading is the most recent post-launch quarter and remains 6.3 points above the Q3 2025 entry.
The 18-to-29 cohort that is moving most decisively toward Apple is also the iPhone segment that cross-shops the most in the dataset. Exclusive Apple loyalty (don’t consider any other brand at all) among 18-to-29 iPhone users is 12.3 percent, the lowest of any age band tracked. Among consumers over 60, exclusive Apple loyalty reaches 35.2 percent, almost three times higher. The young Apple user holds an iPhone today and is also the most open to switching brands for the next purchase.
| Age Cohort | Apple Exclusive Loyalty |
|---|---|
| 18-29 | 12.3% |
| 30-44 | 13.6% |
| 45-60 | 23.9% |
| 60+ | 35.2% |
The combination is unusual. Rising share with low exclusive loyalty indicates Apple is acquiring new young users at scale rather than locking in the ones already there. Position is rising; lock-in is not. Cross-brand consideration data confirms the openness: among 18-to-29 Samsung Flagship users, 30.6 percent considered Apple before their most recent device purchase, the highest cross-Apple consideration rate of any cohort and brand combination in the report. Older cohorts narrow their consideration sets dramatically. Among Apple users over 60, exclusive loyalty at 35.2 percent means more than one in three did not consider any other brand at all. The same shopper behavior that drives high cross-shopping in the young cohort also yields a stable share among older cohorts. Apple is winning the conversion contest in this cohort. Cross-shopping consideration runs both ways, but the realized installed-base share movement of 6.3 points net runs to Apple.
Google’s installed-base share never exceeds 4.3 percent in any age cohort. Motorola peaks at 9.1 percent in the 45-to-60 cohort. Neither brand’s age curve approaches the spread shown by Samsung Flagship or Apple Flagship in the premium tier. The mass-market US smartphone story is an Apple-Samsung story; Google and Motorola compete inside narrower segments.
What this picture suggests for OEM and carrier strategy is asymmetric. Apple’s 18-to-29 share gains arrive without the loyalty buffer that the 45-to-60 and 60-plus shares carry. Samsung Flagship’s natural addressable opportunity is not in the cohort it has lost most ground in, but in the 60-plus cohort, where the premium-tier gap is narrowest and where the brand’s combined book already exceeds Apple’s. Carrier-led upgrade campaigns converting Samsung Non-Flagship users to Galaxy S face different population profiles across target cohorts. The young cohort that Apple is gaining is also the cohort most likely to consider switching.
The Galaxy S26 launched in January 2026, within the most recent quarter in the data window. Q2 2026 will be the first full post-launch quarter to confirm whether Samsung Flagship’s 18-to-29 decline is a structural pattern or a launch-cycle artifact.
Apple’s 38 percent Flagship installed-base share among 60-plus consumers represents the brand’s smallest cohort lead. The structural question is whether today’s 18-to-29 cohort, which has the lowest level of exclusive Apple loyalty in the market, stays with Apple as it ages. The share gains in 18-to-29 are real. So is the openness to change.
This article draws on the demographic findings of Recon Analytics new report, US Consumer Device Purchase Journey Part 4: Demographic Segmentation and the Upgrade Pipeline. The full report covers gender, ethnic community, geographic, consideration, and feature-priority segmentation across all four major US smartphone brands, plus quarterly trend cuts from Q3 2025 to Q1 2026.
If you are interested in the full report, you can find it here:
Digital Products – Recon Analytics