Thanks to its “Un-Carrier” program and acquisition of Sprint, T-Mobile has gone from an “also ran” in the U.S consumer market to one of its dominant service providers. It has also gained a foothold in the small business/SOHO market where the purchasing habits of businesses are not that far from those of consumers. However, the company’s ambitions do not stop there. As former CEO Mike Sievert said at T-Mobile’s September 2024 Capital Markets Day, the company wants to gain share with midsize and enterprise businesses to ensure continued subscriber growth. Achieving that objective requires T-Mobile to move beyond its current Un-Carrier playbook to offer services that appeal to the more demanding requirements of those business segments. One of the services T-Mobile has launched since then to help achieve that goal is SuperMobile, and early response has been positive.

As a quick reminder T-Mobile unveiled its SuperMobile plan in late August of 2025. The plan had six main features upon its launched: network slice to enable lower latency and higher speeds in time of network congestion, unlimited voice and data, built in threat protection security, nationwide satellite connectivity, a now expired promotion of up to $1,000 back per line when adding 10 or more lines, and $42/month/per line (excluding taxes and fees) when adding six or more lines. Some of the early SuperMobile wins for T-Mobile have been with Delta Airlines, CNN, and Siemens Energy. These major wins are just the “tip of the iceberg’; more wins are sure to come.

When Recon Analytics surveyed U.S. businesses, well over 50% of enterprise and midsize business respondents had a favorable outlook on switching to T-Mobile to take advantage of the SuperMobile offering.

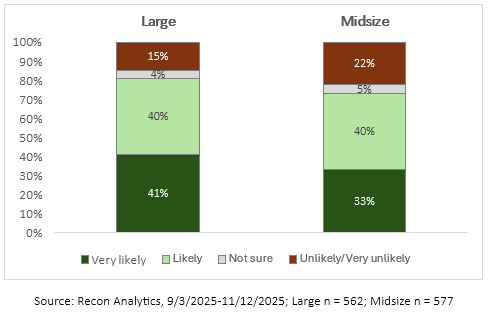
Between September 3rd, 2025, and November 12th, 2025, Recon Analytics surveyed 562 large businesses (1,000 + employees) and 577 midsize businesses (20-999 employees) on the likelihood they would switch to a SuperMobile type of service within the next 12 months. For the survey we did not specifically call it SuperMobile. Instead, we listed out the six key initial features of SuperMobile. Respondents could answer in five ways: very likely, likely, not sure, unlikely, and very unlikely. Roughly half the respondents were told the service was offered by T-Mobile, the other half were given no specific service provider information. The results are below for those who answered specifically to T-Mobile.

Likelihood of switching to T-Mobile’s SuperMobile in the Next 12 Months

As the results show, 81% of large businesses and 73% of midsize businesses said they were either “very likely” or “likely” to switch to T-Mobile within the next 12 months to take advantage of SuperMobile. Respondents who answered the question that did not specify T-Mobile provided similar results when combining “very likely” and “likely.” Where the difference lies between the two versions of the question is the percentage of respondents who answered, “very likely.” For the unbranded version of the question 22% of large business and 19% of midsize business respondents said, “very likely” versus 41% of large business and 33% of midsize businesses answering “very likely” for the branded question. The addition of T-Mobile branding had a net positive impact on the interest level in SuperMobile.

Of course, not everyone who responded positively to the question will actually switch in the next 12 months, but it does show T-Mobile has put together a service offer that will make it more competitive when it comes to selling wireless services to those segments.

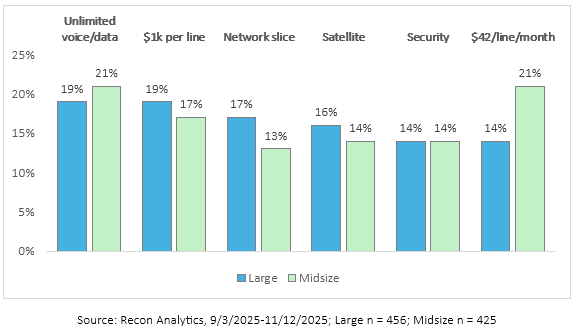
To get a better understanding of what specifically made respondents answer “very likely” or “likely” to switching to SuperMobile we asked them to rate the initial six service features from 1 to 6, with one being the most important. The figure below shows the percentage of respondents, by size of business, which ranked each service feature number 1.

SuperMobile Features That are Most Compelling (Sum Rank 1)

There was little difference in rankings between large and midsize businesses with the exception of network slice and $42 per line per month with 6 lines or more. For all the other features large and midsize were within two percentage points of each other. Within the large business segment, the spread from the most popular feature to the least was five percentage points. Within the medium business segment, the spread between the most popular to least popular feature was bigger at 8 percentage points.

When looking at the results as a whole, unlimited voice and data, the now expired promo offering $1k rebate per line, and service pricing of $42 per line per month with 6 lines or more were the most important features in persuading respondents to switch, but that doesn’t mean the other features are not important in creating the value proposition of SuperMobile.

When summing the rankings from one to six, no feature had a total ranking lower than 74%. This means competing mobile service providers will have difficulty countering T-Mobile’s SuperMobile by going after just one or two features. Nor does the $1k promo expiration mean that interest in SuperMobile will evaporate. Competitors will need to create a service similar to SuperMobile that brings together all of SuperMobile’s ongoing features. Network slicing and satellite connectivity are the two hardest features to replicate, but AT&T and Verizon have the assets and relationships needed to come up with their own version of SuperMobile.

SuperMobile is an important step forward for T-Mobile when it comes to gaining share with larger businesses. Both large and midsize businesses are showing strong interest in the service. The level of interest in the underlying features that make up the service shows that T-Mobile’s competitors cannot easily fight back by just focusing on one or two aspects of SuperMobile. They will need to build a comprehensive service offering like SuperMobile. It is still early days for SuperMobile, but I will be surprised if by December of 2026 we do not see some share shifting due to it. I also expect by end of 2026 T-Mobile’s competitors will have launched their own answer to SuperMobile.


Device OEMs and carriers spent much of 2025 positioning AI as the defining reason to upgrade. On-device intelligence, Smarter cameras, Conversational assistants baked into the operating system. The marketing spending behind those messages was substantial. The consumer response, measured in actual purchase decisions, was not.

According to Recon Analytics’ US Consumer Device Purchase Journey — Part 2: Purchase Drivers and Feature Priorities, which tracked purchase behavior across more than 104,000 US respondents from May through December 2025, hardware failure was the single largest purchase driver for every brand tier in every single month of the tracking period. The range ran from 5.6 percent to 13.2 percent across brands, depending on the month. AI feature priority, by contrast, peaked at 5.1 percent for Motorola in December, with Samsung Non-Flagship nearly tied at 5.0 percent in the same month, while Apple and Samsung Flagship were at 4.5 percent and 2.8 percent, respectively. Performance and battery life combined accounted for 27 to 30 percent of feature selections throughout the period. The industry’s marketing story and consumers’ actual motivation have rarely been further apart.

Broken Phones Drive More Sales Than New Ones Do

The report’s most structurally important finding is also its simplest: new model launches do not generate demand. The ‘new model available’ driver accounted for just 1.1-4.6 percent of purchase decisions across brand tiers, the smallest driver in the entire dataset. Hardware failure drove purchases at rates typically two to six times higher across most brand-month combinations, with the gap widest among value-tier brands. Consumers replace devices primarily because their current one no longer functions, not because a shinier one arrived in a press release.

That distinction matters enormously for how carriers and OEMs plan their promotional calendars. Forced-replacement buyers cannot defer. They accept the best available offer when they need a device, not when a manufacturer wants them to buy one. Treating that demand pool as if it were promotion-responsive misreads its urgency structure, and likely leaves margin on the table.

Table 1.1: Device Stopped Working — Forced Replacement Cycle, May–Dec 2025

Source: Recon Analytics US Mobile Device Components Survey.

The data also reveals a counterintuitive finding about hardware quality that runs counter to the value-segment narrative. Budget devices do not just cost less; they wear out faster. As Table 1.1a shows, Motorola users hold their phones for an average of 1.88 years, the shortest tenure in the dataset, yet their average failure rate is 10.7 percent. Samsung Flagship users hold their devices for an average of 2.62 years, the longest tenure of any tracked brand, and register a failure rate of just 8.1 percent.

Table 1.1a: Estimated Average Device Tenure by Brand, Q4 2025

Source: Recon Analytics US Mobile Device Components Survey.

Premium hardware withstands extended ownership better than budget hardware, consistent with patterns observed throughout the study period. Apple users average 2.24 years of device tenure and register the lowest failure rate in the dataset at 7.9 percent, confirming that the tenure-failure inversion holds across both premium tiers. Motorola’s 9.2 percent fresh-acquisition rate, the highest among tracked brands, is not evidence of strong organic demand. It is the downstream consequence of a replacement cycle that restarts sooner due to the original hardware degrading faster. That is a structural ceiling on how much margin any promotional strategy can recover in the value segment.

The Carrier Calendar Runs the Market

If hardware failure drives those who replace their device, carrier promotional calendars drive when they do it. The seasonal signature for promotional offers—July peaks for back-to-school, August troughs as campaigns close, and November-December rebounds around Black Friday —appeared in lockstep across all five brand tiers tracked in the study: Apple, Samsung Flagship, Samsung Non-Flagship, Google/Pixel, and Motorola. Five tiers with entirely different products, price points, launch windows, and marketing strategies, all moving in the same seasonal rhythm.

The most parsimonious interpretation is that OEM launch timing does not govern purchase decisions at the market level. It is the carrier promotional calendar operating as a shared timing mechanism across the entire industry. OEMs that plan demand forecasts primarily around their own launch events are possibly treating a secondary driver as the primary one.

Software update obsolescence is the one driver that offers a genuine structural advantage to carriers and OEMs willing to exploit it. Running at roughly half the rate of hardware failure, 2.6 to 6.2 percent across the period, update-obsolescence buyers are the most forecastable pool in the market. End-of-support dates are published in advance. The affected device population is identifiable by model. The replacement decision, once support expires, is non-discretionary. Carriers with visibility into device models on their networks can reach those buyers three to six months before the end-of-support date, ahead of competitive search, with an offer calibrated to urgency. No other driver in the dataset offers that combination of predictability and addressability.

Google’s Numbers Tell a Different Story Than They Appear To

The Pixel data in this report is the most analytically complex and the most instructive for understanding how launch-dependent demand differs from organic demand.

Google’s purchase driver and feature priority metrics exhibit a consistent trough pattern in May and August, which appears in every table in the report. May’s lower readings reflect Pixel 9a launch dynamics: a-series buyers who purchased at general availability are newer-device holders with less accumulated hardware frustration and weaker brand motivation than the core Pixel base. Their inclusion in the May survey pool dilutes urgency metrics across the board. Google’s May failure rate of 6.8 percent and August reading of 5.9 percent are the two lowest in the Google series for exactly these reasons.

August is more complicated. The buyers who responded most urgently to July’s concentrated promotional activity had already converted by the time August surveys ran. Google’s July failure rate hit 13.2 percent, the highest reading for any brand in any month, as long-tenure Pixel 9-era holders reached their breaking point. Then it collapsed to 5.9 percent in August. The 95 percent confidence intervals for those two months, July [11.6%, 14.8%] and August [3.9%, 7.9%], are non-overlapping (z = -5.61), confirming that this is a compositional shift rather than sampling noise. On top of that, the Pixel 10 launched on August 28, meaning brand-motivated upgrade buyers were in a pre-purchase holding pattern for 28 of August’s 31 days. They showed up in September.

The result is that Google’s battery priority dropped by 9.9 percentage points from July to August, the largest confirmed metric swing across all ten feature categories in the dataset. Google’s brand reputation reading hit 2.9 percent in August, the series nadir, then recovered to 7.4 percent in December, the highest reading in the Google series and among the highest readings of any brand in any month during the study period. Both numbers are real. Neither is representative of Pixel’s underlying demand dynamics. Carriers and analysts reading Google’s monthly metrics without accounting for these structural troughs will systematically misread the brand’s actual competitive position.

What the Replacement Pipeline Looks Like Entering 2026

The demand picture for 2026 is governed less by any specific promotional campaign or AI feature rollout than by tenure and hardware degradation operating across a large installed base.

Samsung Flagship enters 2026 with 64.4 percent of its installed base in the two-plus-year upgrade window, the highest upgrade-eligible share of any brand, consistent with its 2.62-year average tenure. Apple’s 51.8 percent upgrade-eligible share, applied to its 55.9 percent installed-base share, produces the largest absolute pool of replacement-ready consumers in the market. Both pools are motivated primarily by performance and battery urgency, with carrier promotional offers providing the timing trigger rather than the underlying motivation.

Feature priorities tell a consistent story across the entire study period. Performance and battery lead every brand tier every month. Camera and storage form a durable secondary tier. AI feature priority, despite 12 months of industry marketing, remains below display quality and well below the hardware fundamentals that have driven replacement decisions for the better part of a decade. That gap may narrow as on-device AI capabilities mature and differentiate more visibly in daily use. Whether AI features will drive purchases in subsequent cycles as consumer familiarity grows is beyond the scope of this study, but nothing in the 2025 data suggests an inflection point is near. In 2025, according to the data, it had not narrowed yet.

The consumers replacing their phones in 2026 will mostly be doing it because something stopped working, or because a carrier made them a deal they could not ignore, or because their three-year-old Motorola finally gave up. This pipeline estimate assumes carrier promotional intensity and consumer credit conditions remain broadly consistent with 2025; a meaningful macro contraction or carrier subsidy reallocation toward broadband convergence rather than device promotions would compress conversion from the replacement-ready pool. The AI pitch may be the reason they choose one device over another at the moment of purchase. It is almost certainly not the reason they walked into the store.


Note: This report tracks completed purchase journeys. The survey captures US consumers who completed a device purchase during the study period. Consumers who considered upgrading but did not purchase are not represented in the data. The finding that AI features did not drive completed purchases is robust; whether AI features contributed to purchase deferrals cannot be determined from this dataset. This analysis covers US consumer purchases only. Enterprise procurement, trade-in program dynamics, and international markets are outside the scope of this dataset and may differ materially. Carrier-switching dynamics, including switching rates by brand tier and the role of competitive offers in driving net additions, are tracked separately and will be published in a forthcoming report in this series.

Recon Analytics’ US Consumer Device Purchase Journey report series, based on the Recon Analytics US Mobile Device Components Survey, covers more than 104,000 US respondents across five consecutive quarters from Q4 2024 through Q4 2025. You can find it here: US Consumer Device Purchase Journey – Part 2: Purchase Drivers and Feature Priorities

ANALYSIS | US SMARTPHONE MARKET

The US smartphone market loves good narratives. Apple versus Samsung. Premium versus value. Loyal fans versus deal-hungry switchers. A new deep dive from Recon Analytics, based on 104,408 US consumers tracked over five quarters, is here to complicate every one of those stories.

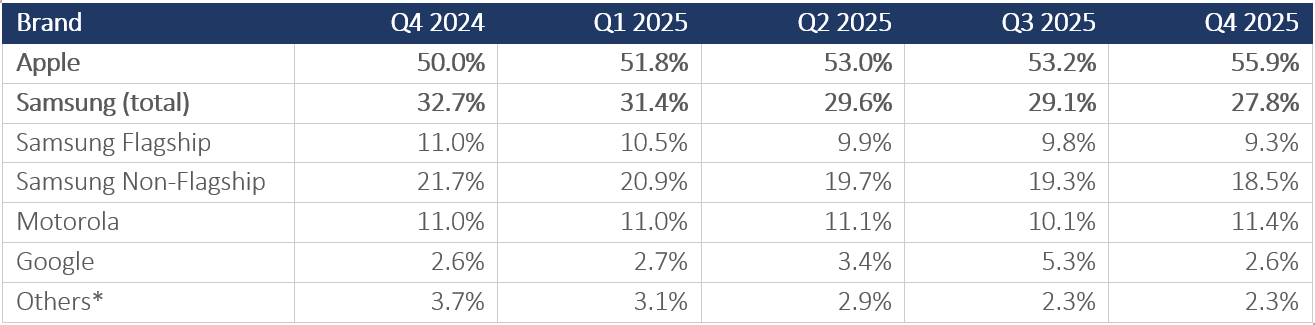
The headline is blunt: Apple ended 2025 with 55.9 percent of the US installed base, up 5.9 points in a single year. Samsung fell 4.9 points to 27.8 percent. The gap between the two brands, 28.1 points, is now 62 percent wider than it was twelve months ago. Five consecutive quarters of directional movement, with share gains accelerating rather than moderating, is consistent with a structural realignment rather than a cyclical fluctuation. The 2026 upgrade data will be the definitive test. The market share here is the installed base of over 104,000 US consumers, whose device information was passively collected during the survey. While we believe the data is robust, with a 0.3% margin of error (95% CI), the market share may still differ from the traditional shipments-based market share. The quarterly market-share trends based on the installed base provide a more directional analysis of the market than an absolute one.

Table 1.1: Quarterly Market Share Trends (% of Installed Base)

Note: *Others include OnePlus, LG, TCL, Xiaomi, Nokia, BLU, and remaining brands. Source: Recon Analytics US Mobile Device Components survey, Q4 2024–Q4 2025.

The Ecosystem Trap Nobody Can Escape

Apple is not winning on specs. The iPhone 17 series ships with a smaller battery than leading Android rivals. Its camera array does not top the industry benchmarks. What Apple has built instead is a gravitational field: iMessage, AirDrop, FaceTime, and the seamless handoff between iPhone, iPad, Mac, and Watch. Switching away from Apple does not just mean buying a new phone; it means abandoning a digital life. No hardware specification can compete against that.

The data confirms what Apple’s own marketing has long implied: its best salesperson is a current iPhone user. Friends and family recommendations ranked as the top research source for Apple buyers every single month across the May–December 2025 tracking period. No paid media budget can replicate a word-of-mouth engine that runs entirely within an installed base of 150 million-plus American consumers.

Samsung’s Two-Brand Problem

Here is the part of the Samsung story that most competitive analyses get wrong: there is no single Samsung. There are two, and blending them together produces numbers that are wrong for both.

Samsung Flagship, the Galaxy S, Z Fold, and Z Flip series, averaged $1,056 per device in Q4 2025 (Recon Analytics US Mobile Device Components survey, Q4 2024 – Q5 2025). That is $69 above Apple’s average of $987. Samsung’s premium users are paying more than iPhone users. The Galaxy S and Ultra command high customer satisfaction, with a flagship satisfaction score (cNPS) of 32.4 (n=37,302, May-Dec 2025), compared to Apple’s 30.4 (n=107,406, May-Dec 2025). Note: the 2.0-point gap between these scores sits at the cNPS noise threshold; confirm subgroup-level margin of error before asserting a directional lead. The component net promoter score (cNPS) is Recon Analytics’ proprietary version of the NPS. Recon Analytics’ cNPS covers smartphones from 22 dimensions. Also, 64.4 percent of the Samsung flagship installed base is now in the 2-plus-year upgrade-eligible window. That is the most financially concentrated upgrade opportunity in Android heading into 2026.

Then there is Samsung Non-Flagship, the Galaxy A-series, averaging $243 per device in Q4 2025, down sharply from $316 a year ago (Recon Analytics US Mobile Device Components survey, Q4 2024–Q4 2025). Its satisfaction score (cNPS) sits at 22.3, with 26.9 percent of users actively detracting from the brand. The A-series does not just underperform; it creates potential brand-perception drag that shadows every Samsung consumer evaluation. The $813 gap between Samsung’s two tiers is the starkest within-brand pricing divide in the market.

The consideration data makes the structural problem concrete. Samsung Non-Flagship buyers cross-shop Apple at a higher rate than Samsung Flagship buyers, 23.1 percent versus 20.5 percent (Recon Analytics US Mobile Device Components survey, May-Dec 2025; Samsung Non-Flagship, n= 32,263, and Flagship n=37,302 respectively), and that gap widened through the second half of 2025. Whether this reflects an aspirational pull toward Apple specifically or the generally higher brand fluidity among value-tier buyers is a distinction the consideration data raises but does not fully resolve; both mechanisms likely contribute.

Google Ran an Experiment. The Results Were Not Encouraging.

Google’s 2025 is a case study in the difference between rented share and owned share. Pixel climbed from 2.6 percent of the US installed base in Q4 2024 to 5.3 percent in Q3 2025, driven by carrier promotions and the launch of the Pixel 10. By Q4 2025, it was back at exactly 2.6 percent. Exactly where it started. The precision of that reversion is striking.

The hardware was not the problem. Google Pixel Pro earned the highest device-level satisfaction score (cNPS) in the entire dataset, 33.2 cNPS, with the lowest detractor rate among all flagship-tier devices. The product genuinely converts buyers into advocates. The challenge is that Pixel advocacy operates largely outside the physical environment where most purchase decisions are finalized. Pixel devices appear on carrier websites, but are underrepresented in the physical store, according to Recon Analytics’ survey data (see upcoming Consumer Device Purchase Journey – Part 3 report), 53 to 55 percent of US device sales through carrier and big-box channels are driven by in-store staff recommendations, floor placement, and promotional subsidies — not web listings. A phone can be available online and still be invisible at the point of conversion. That is Google’s distribution problem: not absence from the catalog, but absence from the moment that matters.

Google’s 2025 trajectory is the reference point every brand strategist in this market should keep close to. A promotion without a plan for what happens when it ends is a subsidy, not a growth strategy.

Motorola Does Not Get Enough Credit

While the industry fixates on the premium tier, Motorola has quietly done something harder than it looks: hold ground. The brand maintained 11.0 to 11.4 percent share across all five tracked quarters, with a consistent Q4 seasonal lift driven by holiday gift purchases. Its average device price runs around $313 to $333, flat across the year, with no pretensions toward premiumization. Motorola’s franchise is built on carrier placement and price discipline, and it executes that positioning with a consistency that belies its unglamorous reputation.

The satisfaction picture is mixed: non-flagship CNPS at 20.7 (cNPS), with 28.6 percent detractors, suggests elevated hardware quality friction at the low end, but the brand’s structural stability in a year when Samsung shed nearly 5 points is nothing.

The Upgrade Pipeline That Will Define 2026

Here is the question that makes 2025’s data genuinely consequential: what happens to the upgrade cycle next year?

Apple’s 51.9 percent upgrade-eligible rate, applied to its dominant installed base, produces the largest absolute pool of upgrade-ready consumers in the market. Samsung Flagship’s 64.4 percent eligible rate, though applied to a smaller base, represents the single most financially concentrated upgrade opportunity in Android. The two pools together define the 2026 replacement market.

Samsung’s most immediate strategic decision is whether it converts that aging flagship base before Apple does. Galaxy S users are holding devices longer than any other tracked segment and are currently cross-shopping Pixel as their primary Android reference point rather than iPhone. That is a narrower competitive window than most Samsung strategists probably assume. If Samsung can capture the upgrade cycle with its own flagship base, the share-loss story changes. If Apple absorbs another wave of premium converts, the 28-point gap could widen further.

The data does not predict outcomes. But it tells you exactly where the pressure points are, which side has the momentum, and which brand’s growth is real. Right now, Apple has the momentum. Google has the product but not the shelf. Samsung has two businesses that need two strategies. And Motorola has quietly survived a year that was much rougher than the headline numbers suggest.

The 2026 upgrade cycle is loaded. Whoever takes it may well determine whether this is a structural realignment or a temporary gap. The thesis that this is a structural shift, not a cycle, has three observable tests. First: if Samsung Galaxy S26 captures more than 55 percent of its own upgrade-eligible base in Q1-Q2 2026, the share-loss momentum is arrestable. Second: if Apple’s installed base reaches 58 percent by Q2 2026, the shift is accelerating past Samsung’s realistic recovery window. Third: if Google’s share holds above 3.5 percent through Q2 2026 without a promotional event, it has converted rented share into owned share for the first time. Any one of these outcomes materially changes the 2026 forecast.

Note: This analysis covers the US smartphone installed base from Q4 2024 through Q4 2025. It does not address global market dynamics where Samsung’s competitive position differs materially; carrier incentive structures that drive short-term share movements independent of brand preference; or price elasticity effects that may account for some portion of Apple’s installed base growth. These variables are available for analysis in subsequent phases of the device-purchase-journey study. If you want to find out more about the Recon Analytics’ US Consumer Device Purchase Journey Part 1: Market Landscape, Brand Performance & Consumer Satisfaction report, which is based on 104,408 US respondents tracked from Q4 2024 through Q4 2025, please visit here: US Consumer Device Purchase Journey – Part 1: Market Landscape, Brand Performance & Consumer Satisfaction – Digital Product Reports

Verizon’s nationwide wireless outage on January 14, 2026, was the kind of event that doesn’t just disrupt a Tuesday: it hands every competitor field rep a talking point they’ll use for the next 18 months. Recon Analytics surveyed 1,702 business decision-makers between January 21 and February 25, 2026, capturing reactions in the immediate aftermath. The results tell a story that is both better and worse for Verizon than the company probably wants to hear.

The Outage Was Not Felt Equally

The January 14 outage was not a uniform experience across the business market. Impact scaled with company size, and the 23-percentage-point spread between large and small business is the first structural finding.

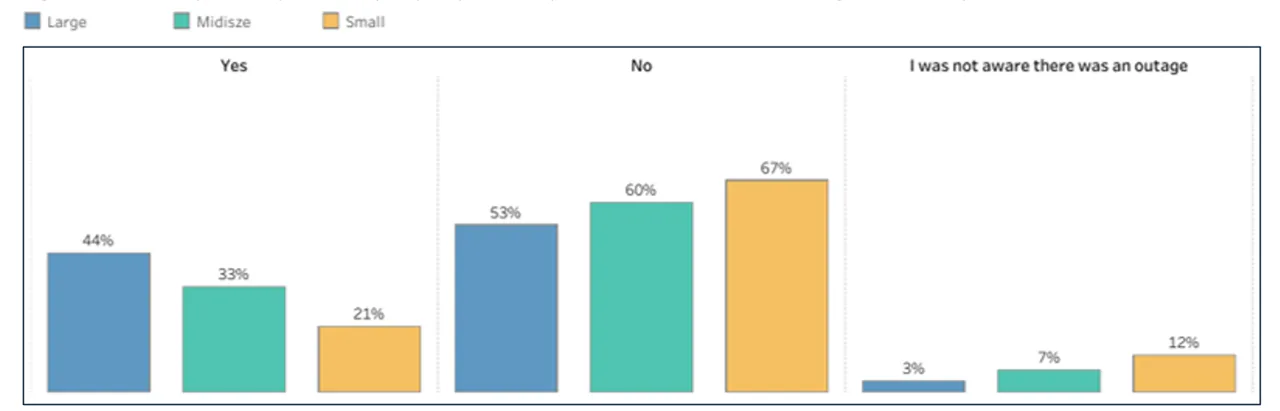
Large businesses reported the highest direct impact: 44% said the outage affected their company. Midsize companies came in at 33%. Small businesses sat at 21%. The remaining respondents in each segment indicated either no impact or were unsure. The gradient makes operational sense. Large organizations run more lines, more devices, more mission-critical workflows over wireless. A national field service operation or a distributed retail chain has thousands of points of exposure. A five-person shop has a handful. The outage hit large businesses hardest because they have the largest surface area. Large enterprises also operate more redundancy infrastructure, dedicated IT, secondary carrier contracts, Wi-Fi fallback. Whether the 44% figure reflects greater network dependency or greater issue-reporting sensitivity is not separable from this data.

The awareness data runs in the opposite direction. Among small businesses, 12% said they weren’t even aware an outage had occurred, compared to 3% of large enterprises and 7% of midsize. Small businesses run lean. If the phones worked well enough that day, or if the outage was brief enough in their geography, it didn’t register as a business event. Large enterprises have someone whose job is to know when the carrier goes down.

This awareness asymmetry matters for Verizon’s sales team. The enterprise segment felt the outage acutely and paid attention. That’s also the segment where Verizon has historically leaned on network reliability as its core value proposition. The pitch is that you pay more because the network doesn’t go down. January 14 complicated that pitch in the accounts where it matters most.

Figure 1: Was anyone in your company impacted by the Verizon Wireless outage of January 14th, 2026?

Source: Recon Analytics B2B Pulse, January 21st-February 25th, 2026. Percentages based on business respondents. Total n = 1,702, MoE = 2.4%; Large Business (1,000+ employees) n = 561, MoE = 4.1%; Midsize (20-999 employees) n = 538, MoE = 4.2%; Small Business (<20 employees) n = 603, MoE = 4.0%

Opinion Change Was Contained, Not Neutral

Among business customers who were aware of the outage, stated opinion change was limited. Across all size segments, roughly two-thirds said the outage did not change their opinion of Verizon. Opinion stability was statistically consistent regardless of company size.

The more operationally significant data is among those whose opinions did shift. Roughly 5-6% across segments said, “much more negative” and 27-29% said “somewhat more negative.” Combined negative sentiment ran approximately 32-35% across all segments. For an event that hit on a single day lasting about 10 hours, generating negative opinion change in roughly a third of aware business customers is a credibility problem if the narrative isn’t actively managed.

One caveat on the “no change” majority: it captures two distinct customer types that the data cannot separate. The first is the genuinely loyal customer who considers this within the bounds of acceptable carrier performance and has no intention of changing anything. The second is the customer who already held a neutral or negative opinion of Verizon before January 14, who are already at risk of leaving. Both sit in the same response bucket. The data cannot tell you how large each population is.

 Figure 2: (only if impacted by outage) How has the network outage changed your opinion of Verizon Wireless?

Source: Recon Analytics B2B Pulse, January 21st-February 25th, 2026. Percentages based on business respondents who indicated they were impacted by the outage. Total n = 551, MoE = 4.2%; Large Business n = 246, MoE = 6.2%; Midsize n = 179, MoE = 7.3%; Small Business n = 126, MoE = 8.7%

The Loyalty Question Is Where the Size Gap Becomes a Revenue Conversation

Because no pre-outage baseline is available for switching intent in this sample, the figures below represent a post-event snapshot, not a measured change from prior intent levels.

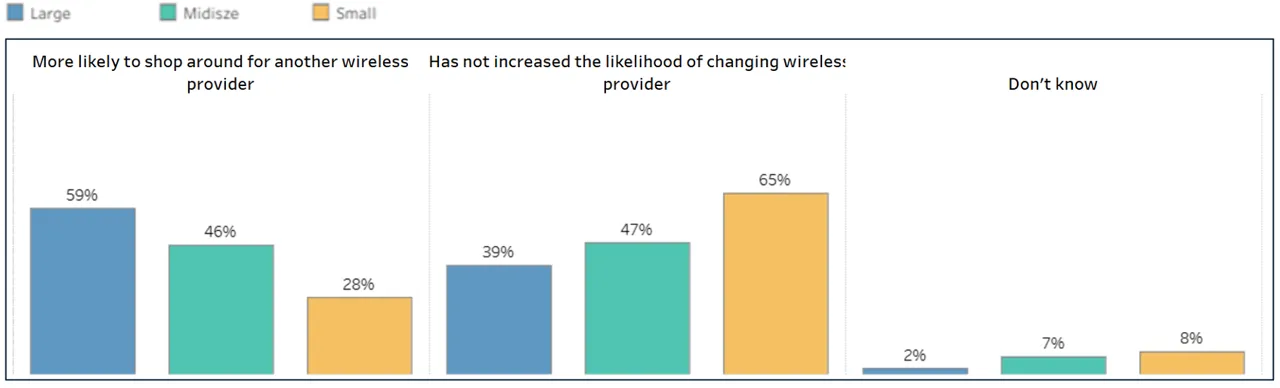
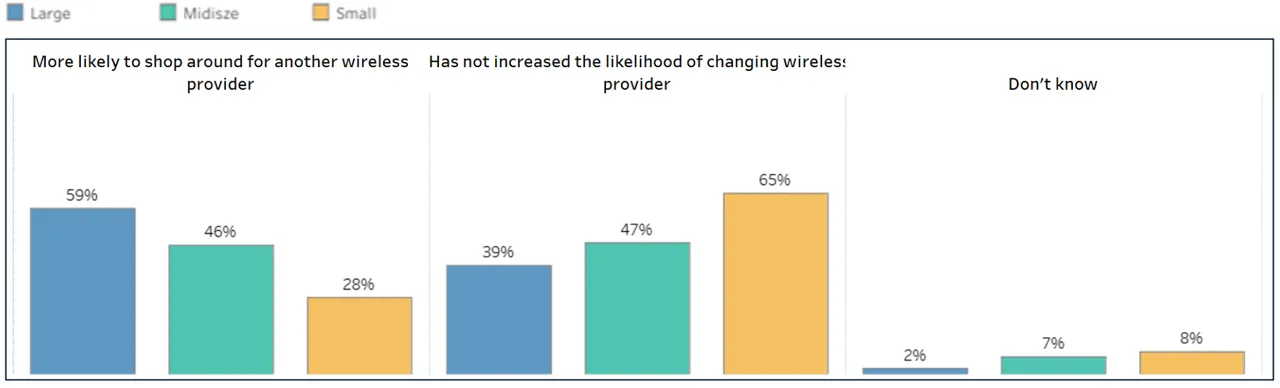
Among current Verizon Wireless business customers asked how the outage affected their likelihood of staying after their current agreement, small businesses were the most forgiving: 65% said the outage had not increased their likelihood of changing providers, 28% said they were more likely to shop around, and 7% were unsure or did not respond. Large businesses showed a different picture, with 39% saying the outage had not increased their likelihood of switching, 59% said they were more likely to evaluate alternatives, and 2% were unsure. Midsize was a statistical tie.

Among large business Verizon customers, 59% said the January 14 outage made them more likely to evaluate alternatives when their contract comes up. Remember, intent to shop is different from switching. Contract lock-in, device payoff schedules, multi-line complexity, and the operational headache of migrating a large business all create meaningful friction between stated intent and revealed behavior. Enterprise switching intent historically overstates eventual switching behavior. Even accounting for that gap, a post-event snapshot where 59% of large business Verizon customers express elevated interest in alternatives is a leading indicator that the competitive pipeline has expanded.

Enterprise wireless agreements typically run one to three years. The cohort of large accounts whose contracts expire in 2026 and 2027 is now at elevated churn risk compared to January 13. Verizon’s enterprise sales team should be in front of those accounts before AT&T and T-Mobile arrive with a pitch deck that opens on January 14.

 Figure 3: (currently using Verizon) How did the outage impact the likelihood of you staying with Verizon Wireless at your next renewal?

Source: Recon Analytics B2B Pulse, January 21st-February 25th, 2026. Percentages based on business respondents who self-reported current Verizon Wireless use. Total n = 510, MoE = 4.3%; Large Business n = 201, MoE = 6.9%; Midsize n = 167, MoE = 7.6%; Small Business n = 142, MoE = 8.2%

The Non-Verizon Market: Enterprise Forgives, Small Business Does Not

Among business customers not currently on Verizon, the outage produced differentiated responses that also track with company size.

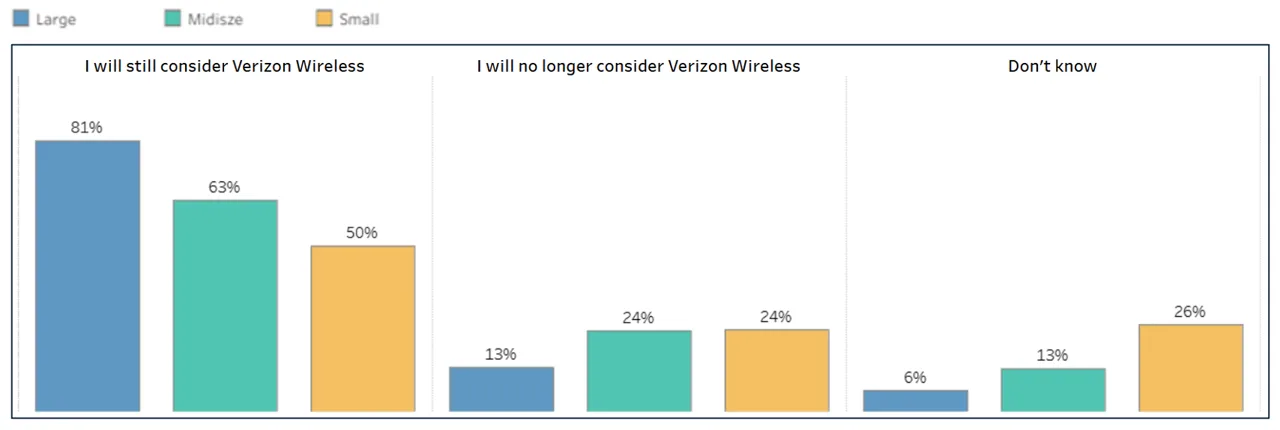
Large businesses remained the most open to Verizon despite the outage: 81% said they would still consider Verizon when their current agreement expires. One bad day doesn’t remove a major carrier from consideration. Enterprise procurement decisions involve pricing, coverage, device ecosystems, and account support infrastructure. Small businesses reacted more negatively to the outage, even though they did not experience the outage directly. 24% of small businesses said they would no longer consider Verizon, while 26% said they were unsure. A single outage is a data point, not a disqualifier, but can unbalance customers that are on the fence.

Figure 4: (Not currently using Verizon) How did the outage impact the likelihood of you considering Verizon Wireless next?

Source: Recon Analytics B2B Pulse, January 21st-February 25th, 2026. Percentages based on business respondents who do not use Verizon Wireless (self-reported). Total n = 1,064, MoE = 3.0%; Large Business n = 341, MoE = 5.3%; Midsize n = 334, MoE = 5.4%; Small Business n = 389, MoE = 5.0%

What Verizon Has to Do Now

The January 14 outage created a two-front problem. In the existing base, large business accounts are at elevated renewal risk. In the prospect market, small businesses have partially written Verizon off. But both are addressable.

Verizon’s enterprise team should prioritize proactive outreach to its large account base before those contracts expire. Generic reliability commitments won’t land. The message needs to be specific: what failed, what was fixed, what redundancy was added, what the SLA improvement looks like going forward. Enterprises don’t need apologies. They need engineering answers.

On the prospect side, the small business perception problem is harder because it’s driven partly by information Verizon doesn’t control. The counter-narrative has to reach small business decision-makers through channels they trust: peer networks, trade media, and the resellers and agents who carry Verizon’s products into that segment.

The January 14 outage was one bad day, which must be addressed with customers to protect accounts that could take years to win back if lost.


RECON ANALYTICS ACQUIRES ATOM INSIGHTS, EXPANDING GLOBAL DEVICE INTELLIGENCE

Boston, MA and Montreal, Canada — March 16, 2026 — Recon Analytics has acquired Atom Insights, a device market intelligence firm with operations in Canada and India. Terms were not disclosed.

Hanish Bhatia, Founder of Atom Insights, joins Recon Analytics as Vice President of Device Intelligence. Bhatia previously served as Associate Director at Counterpoint Research, where he covered global smartphone and device markets for seven years. All employees of Recon Analytics Canada, Recon’s U.S.-based device intelligence group, and its India operations will report to Bhatia.

The acquisition integrates Atom Insights’ global device shipment, sell-through, and component-level intelligence into Recon’s customer research platform, creating the industry’s first end-to-end intelligence service from silicon to subscriber sentiment. Atom Insights tracks device sell-through at the model level across 40-plus countries, covering 400-plus device OEMs and 25-plus semiconductor vendors across smartphones, tablets, wearables and PCs.

“We have spent four years building the customer insights infrastructure that the U.S. telecommunications industry runs on. We built this platform deliberately, like a puzzle, with a connector piece already designed for exactly this moment. We can measure what subscribers experience across 22 dimensions of satisfaction matched to their specific handset hardware, and we know what is inside those devices. What we needed was someone who could tell us how many of them shipped, through which channels, and across which markets. Atom Insights and Hanish Bhatia are the piece we built the that connector for,” said Roger Entner, Analyst and Founder of Recon Analytics.

“Recon is the only firm that can show how a specific handset performs on customer satisfaction matched to real hardware IDs, and tell clients what to do about it,” said Bhatia. “Combining that with Atom Insights’ supply-side data creates a device analytics capability that does not exist anywhere else.”

“Atom Insights lets us answer which device configurations drive satisfaction, which component choices create churn risk, and how OEM decisions ripple through carrier economics,” said Brett Clark, Analyst and COO of Recon Analytics.

Atom Insights’ device intelligence integrates alongside Recon’s Pulse service, on which the largest U.S. telecommunications companies rely for competitive decision-making. Pulse fields more than 15,000 U.S. telecom consumers and up to 1,200 telecom businesses weekly in English and Spanish. Beyond telecom, Pulse reaches 6,000 consumer and business AI respondents, the largest AI customer insights service in the world, and up to 6,000 airline travelers weekly.

Atom Insights’ data will also be available across all three tiers of Recon’s AI platform: Ghost Lab for outside-the-firewall analytics across Recon’s insights and 150-plus third-party databases including speed test data, spectrum data as well as government databases; Recon Enclave deployed inside the client’s firewall; and the Reconnaissance Platform, Recon’s autonomous intelligence system for scenario simulation and decision-ready recommendations.

“The analytical frameworks we have built over four years transfer across industries and geographies,” said Entner. “The device value chain is the natural next frontier, and we intend to keep building.”

About Recon Analytics

Recon Analytics is the largest telecom operator-centric market research provider in the United States, with active verticals spanning AI consumer behavior and commercial aviation. The firm’s dataset includes almost a million device-matched respondents and a historical repository of 2 million-plus total respondents. Our Pulse service delivers near real-time customer insights on a weekly basis answering the specific questions our clients are looking for. Recon delivers intelligence through a three-tier AI architecture: Ghost Lab, Recon Enclave, and the Reconnaissance Platform. www.reconanalytics.com


About Atom Insights

Atom Insights provides model-level device sell-through, shipment tracking, semiconductor market analysis across 40-plus countries and 400-plus OEMs. www.atom-insights.com

Media Contact

Sarah Leggett | [email protected]

By Sanjay Mewada, Analyst and Chief Research Officer

The monthly bill is the most frequent touchpoint between the carrier and the customer. More consistent than network usage, more personal than advertising, more consequential than store visits. Yet billing systems remain among the oldest technologies in most operator portfolios. Platforms deployed a decade ago still generate millions of bills monthly, and that legacy shows up directly in customer satisfaction scores and churn rates.

Recon Analytics analyzed 1.47 million US consumer and business survey responses collected from Q3 2022 through Q4 2025 to quantify the billing experience gap. The findings are stark: billing issues drive churn at a 2.5x multiplier, and the carriers with the oldest billing platforms bleed customers to competitors running modern systems. At industry-average lifetime values, billing-related churn costs the Big Three wireless carriers an estimated $2 to $3 billion annually.

T-Mobile’s Platform Advantage Is Real and Persistent

T-Mobile leads wireless bill clarity with a component Net Promoter Score (cNPS) of +17.7, a 10-point advantage over Verizon at +7.1, and a 12-point advantage over AT&T at +5.5. This gap has held steady across 14 consecutive quarters of survey data. The consistency is not coincidental. T-Mobile completed its post-Sprint billing integration on Amdocs’s cloud-native platform in 2021. AT&T and Verizon continue to run hybrid stacks with legacy components dating back to the previous decade.

The quarterly trend data tells the story. AT&T moved from -6.8 in Q4 2022 to +11.9 in Q4 2024, an 18.7-point improvement over two years. Verizon climbed from -0.9 to +13.4, a 14.3-point gain. T-Mobile advanced from +8.8 to +24.0 over the same period. All three carriers improved substantially, suggesting industry-wide investment in billing transparency driven by competitive pressure and regulatory scrutiny. Yet the rank order never changed. T-Mobile’s platform advantage persisted through every quarter.

The prepaid and value-oriented carriers demonstrate what billing simplicity can achieve. Consumer Cellular leads the industry at +44.3 cNPS, followed by Straight Talk at +35.7 and Cricket at +31.5. These carriers benefit from simpler pricing structures with fewer promotional bundles, no multi-line complexity, and straightforward monthly charges. The gap between Cricket at +31.5 and its parent, AT&T, at +5.5 shows that pricing architecture matters more than operational capability. Both run on AT&T systems; only Cricket delivers billing simplicity.

Fixed Wireless Delivers the Best Billing Experience in the Market

The technology hierarchy in billing satisfaction is unambiguous. Fixed wireless customers rate their billing experience 33 points higher than cable broadband customers. T-Mobile FWA leads at +40.6 cNPS, followed by Verizon FWA at +35.0, then a steep drop to AT&T Fiber at +21.6. The cable operators cluster in the low double digits: Spectrum at +13.9, Cox at +12.6, and Xfinity at +7.4.

The fixed wireless advantage stems from greenfield billing deployments. These services launched in 2021 and 2022 on modern BSS platforms with single-price, all-inclusive monthly charges. No promotional layering, no equipment rental fees, no bundled discount complexity. Cable operators manage decades of accumulated pricing structures with promotional rates that expire, bundled discounts across video, internet, and phone, equipment rentals, and regional rate variations.

The 33-point gap between the highest performer, T-Mobile FWA at +40.6, and Xfinity broadband at +7.4 represents the full span of billing experience differentiation in the market. This is the measurable outcome of greenfield billing deployments on modern BSS platforms versus decades of accumulated complexity on legacy systems.

Billing Problems Create a Churn Multiplier Effect

Customers who experience billing problems show 32.5% churn intent, compared with 13.2% for those without billing issues. That 2.5x multiplier directly translates into revenue risk. The carrier-specific data make the exposure concrete.

AT&T customers report the highest incidence of billing problems: 12.0% experienced confusing bills, and 12.1% reported billing errors in the past 90 days. When those AT&T customers have billing issues, 41.3% plan to leave their carrier. Compare that to T-Mobile, where 8.0% experience confusing bills and 33.3% of those plan to leave. Verizon sits in the middle at 8.2% billing confusion incidence with 26.7% churn intent among affected customers.

AT&T faces the worst combination: highest billing issue incidence and highest churn sensitivity among those affected. The 12% incidence rate combined with 41.3% churn sensitivity means roughly 5% of AT&T’s customer base is simultaneously experiencing billing friction and actively planning to leave.

Cricket’s prepaid model delivers meaningfully lower billing friction. At 5.5% bill confusion and 7.0% billing errors, Cricket outperforms its parent AT&T by roughly 50%. The prepaid pricing model — with fixed monthly charges, no promotional layering, no multi-line complexity, and no surprise fees — eliminates most sources of billing confusion.

ISP Billing Support: Technology Determines Everything

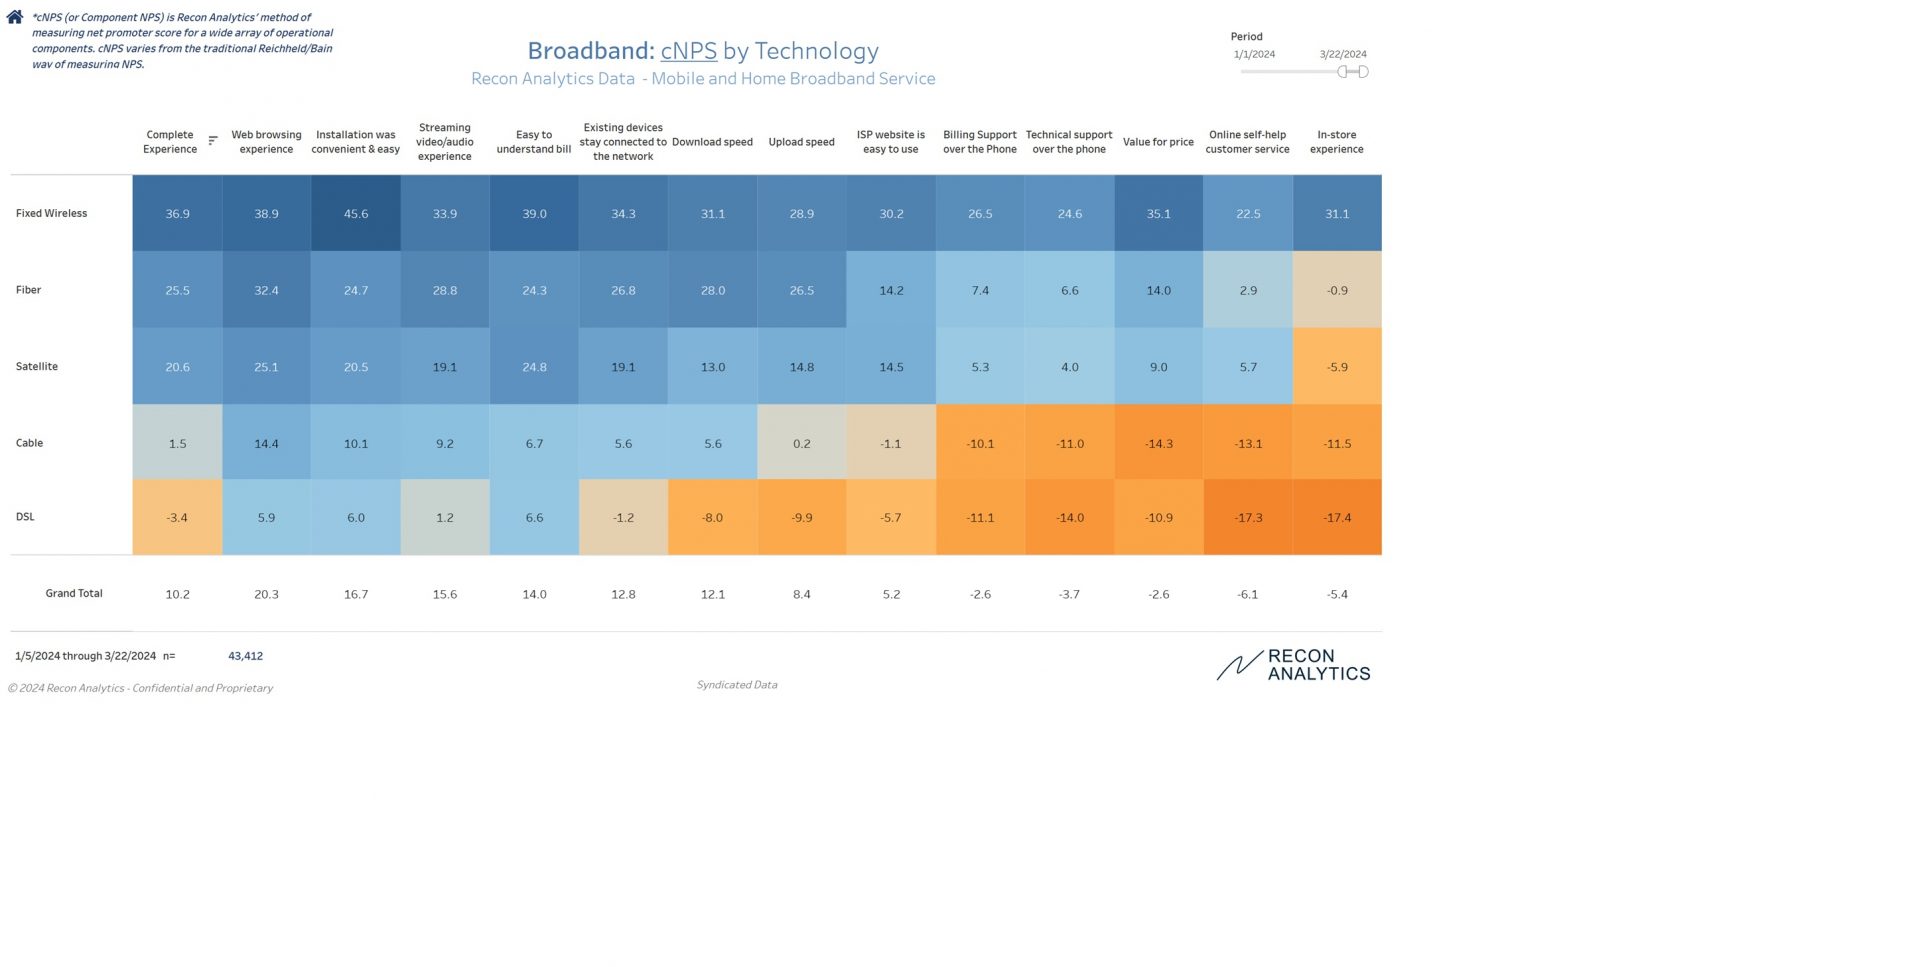
Home internet billing support satisfaction varies dramatically by technology type, and the pattern is consistent enough to consider it structural. Fixed wireless customers rate billing support at +9.6 cNPS aggregate. Fiber customers rate it at +3.3. Cable customers rate it at -12.8. DSL customers rate it at -16.4.

The 26-point gap between the best and worst technology categories reflects decades of accumulated billing complexity in legacy systems versus the clean-slate simplicity of FWA platforms. Verizon Fixed Wireless leads individual providers at +13.8 cNPS for billing support, followed by T-Mobile Fixed Wireless at +11.4. AT&T Fiber sits at +3.6, still positive but well below the FWA leaders. Below the line, Spectrum sits at -9.4, Cox at -12.0, Xfinity at -14.1, and CenturyLink at -21.4.

ISP customers who call for billing questions show dramatically elevated churn intent. Among those who called, 35.8% plan to leave their provider, compared to 18.8% of those who did not need to call. The 17-point gap represents a 1.9x churn multiplier. Every billing support call signals a customer at elevated flight risk.

The Business Segment Shows What Good Support Can Achieve

Business billing support scores substantially exceed consumer scores across all carriers. T-Mobile leads business mobile billing support at +17.7 cNPS, followed closely by AT&T at +17.2 and Verizon at +14.5. The 15 to 20-point premium over consumer scores reflects dedicated account management, enterprise support channels, and business customers’ lower tolerance for poor service.

The narrow spread among carriers — just 3.2 points from top to bottom — indicates that competition in B2B billing support has converged toward a common standard. Elements of the business support model, including dedicated contacts, case ownership, and proactive outreach, could be selectively applied to high-value consumer segments. Premium unlimited plan customers paying $90 or more per month warrant support investment that matches their revenue contribution.

What This Means for the Market

The correlation between BSS platform age and billing cNPS is too consistent to ignore. Carriers running systems deployed before 2020 face structural disadvantage that incremental improvements cannot overcome. AT&T’s 10.7-point improvement in billing support cNPS over three years suggests that platform migration delivers measurable results, but current levels remain negative for most legacy providers.

Competitive exposure intensifies as FWA scales. Fixed wireless providers deliver 25 to 35-point cNPS advantages on billing clarity and support. As FWA expands beyond rural markets into suburban cable footprints, the billing experience gap becomes a competitive weapon. Cable operators face a structural dilemma: their bundled service model creates billing complexity that FWA’s simple pricing avoids.

Price dominates stated churn reasons across both wireless and ISP categories. Verizon intenders cite “too expensive” at 25.6%, significantly higher than AT&T at 18.2% and T-Mobile at 15.2%. Among ISP customers planning to leave, Spectrum customers cite price at 40.6%, followed by Cox at 38.5%, Xfinity at 37.7%, and Verizon Fios at 34.8%. The dominance of price as a churn driver reinforces the importance of billing clarity. Customers who perceive their bills as unpredictable or confusing experience price as a larger pain point than those who understand exactly what they’re paying for.

Regulatory and reputational risks compound the financial exposure. The FCC’s billing transparency requirements continue to tighten. State attorneys general pursue billing practice investigations. Consumer advocacy groups amplify complaints through social media. Operators with high billing complaint volumes face reputational damage beyond the direct customer impact.

The carriers and ISPs that invest in platform modernization, pricing simplification, and support excellence will capture disproportionate share of customer loyalty and lifetime value. Those that treat billing as a cost center will continue bleeding customers to competitors who understand that every bill is a moment of truth.

The comprehensive report providing deeper analysis, conclusions, and recommendations is available on ReconAnalytics.com.

Methodology: Recon Analytics surveyed 1.47 million US consumer respondents and 53,000 business respondents from Q3 2022 through Q4 2025. Component NPS (cNPS) calculated using standard methodology: percentage of promoters (9-10 scores) minus percentage of detractors (0-6 scores). Current as of December 28, 2025.

Contact: [email protected]

Sowmyanarayan Sampath is out as CEO of Verizon Consumer Group, effective March 31. Dan Schulman announced the departure this morning in an internal letter layered with corporate gratitude and strategic intent. Alfonso Villanueva, Schulman’s former PayPal colleague who joined Verizon barely ten weeks ago as Chief Transformation Officer, takes the interim role. The word interim is doing a lot of work in that sentence.

I wrote in October that Sampath was “the undisputed heir apparent” and that Schulman’s appointment was a “special mission with a defined timeline” designed to set the stage for Sampath to inherit the company. I was wrong. So was most of Wall Street. When you’re wrong, you say so, explain why, and recalibrate.

The $4 Million Tell

The signs were in the SEC filings. The 8-K/A filed on October 14, nine days after Schulman took the CEO job, disclosed a $4 million one-time retention RSU award for Sampath, vesting December 31, 2027. You don’t pay someone $4 million to stay unless you think they might leave, and you don’t think they might leave unless the succession conversation went badly. That retention award was designed to keep Sampath in place while Schulman assessed the team. It was a bridge, and it led nowhere.

Schulman came in with his own vision and his own people. Villanueva arrived from PayPal on November 20. Within two months, he had absorbed strategy, corporate development, data/analytics/AI, and supply chain under his Transformation Organization. Now he runs the consumer business too. This wasn’t a performance termination. Sampath was most likely told he would not succeed Schulman as Verizon CEO. Once that became clear, his departure was inevitable. An executive of his caliber with multiple offers wasn’t going to stay as a subordinate with no path to the top job.

The Q4 Numbers: Schulman’s Plan, Sampath’s Execution

The Q4 results need proper attribution. Verizon added 551,000 consumer postpaid phone subscribers in Q4, the best quarter since 2019. For the full year, consumer postpaid phone net adds came to positive 137,000 after losses of 356,000 in Q1, 51,000 in Q2, and 7,000 in Q3. Add the Business segment’s 225,000 phone net adds and total retail postpaid phone connections grew by roughly 362,000 in 2025. Verizon broke even on its most important subscriber metric after years of persistent losses.

That Q4 turnaround was Schulman’s strategy. He directed the spend-to-grow posture during his October earnings call. Sampath executed the plan, delivering 2,679,000 consumer postpaid phone gross additions in Q4, up 15% year-over-year. The gross add performance was strong. The churn problem remains: 0.95% in Q4 versus 0.88% a year ago, part of a steady climb from 0.83% in Q1 2024 across every single quarter. That 12-basis-point churn increase on a base of 75 million consumer postpaid phones translates to roughly 90,000 additional lost subscribers per quarter, or about $540 million in annualized revenue walking out the door that wasn’t leaving two years ago. Stopping that escalation is the unresolved challenge.

The financial profile tells the story of what aggressive growth costs. Consumer segment EBITDA for full year 2025 was $43.8 billion on revenue of $106.8 billion, a margin of 41.0% versus 41.8% in 2024. The Q4 consumer EBITDA margin compressed to 36.5% from 37.5% a year ago, and wireless equipment revenue jumped to $8.2 billion from $7.5 billion as Verizon spent heavily on device subsidies to drive those gross adds. The fundamental tension Schulman is navigating: buy growth now, restructure costs to fund it, and find the right permanent leader to sustain both without destroying the margin structure that supports a $11.5 billion annual dividend.

Where the October Analysis Broke Down

The October analysis underestimated Schulman’s intensity. He cut 13,000 jobs within weeks, began franchising 179 retail stores, and brought in his own transformation chief from PayPal. That’s not bridge management. It also underestimated the depth of the board’s frustration. Verizon’s consumer postpaid phone base was essentially flat for three consecutive years. ARPA kept climbing, from $141.31 in Q1 2024 to $147.36 in Q4 2025, but extracting more revenue from a stagnant base is a finite strategy. Most simply, Sampath was told he wouldn’t get the CEO job. Stay and execute someone else’s vision with no upside, or leave and run something. He chose correctly.

The Rescue Team Has an Expiration Date

Schulman and his team are a rescue operation, not a long-term management structure. Schulman is 67. His contract runs through December 2027. Villanueva is from the same professional generation. It’s very likely that they will be gone in two years but the timeline might be slipping due to operational necessities.

The Consumer Group CEO hire isn’t just about filling Sampath’s seat. It’s an audition for the person who will eventually run all of Verizon. Whoever takes this job permanently is being positioned for the corner office. That changes the candidate profile: Verizon isn’t looking for a division head. It’s looking for a future CEO who starts in the consumer role, with the operational depth to run a $107 billion revenue business and the strategic vision to navigate convergence across wireless, fiber, and FWA.

It also changes the competitive dynamics of the U.S. wireless market. A Consumer CEO who is auditioning for the overall CEO job cannot tread water. Treading water gets you passed over. Going backward is unthinkable. The person in that seat will have every incentive to compete aggressively, because their personal career trajectory depends on delivering visible, measurable wins on a compressed timeline. Whoever lands in this role will be the most motivated competitor Verizon has fielded in years.

Why Europe

The permanent replacement will most likely come from outside the United States. The reason is structural: non-compete agreements. Any senior executive at AT&T, T-Mobile, or a major cable operator is almost certainly bound by non-compete clauses. International candidates, particularly from European operators, don’t carry that baggage. European non-competes are weaker by law, and the competitive overlap with Verizon’s U.S. consumer business is zero.

Verizon’s one unambiguous success in the Consumer Group CEO role was Ronan Dunne, recruited from O2 in the UK. He ran O2 for eight years, grew its base from 18 million to 25 million, and served five productive years at Verizon. The one failure, Manon Brouillette from Canada’s Videotron, proves that scale matters, not that international hires are risky. O2 was the right weight class. Videotron was not.

T-Mobile’s succession provides a useful contrast. Srini Gopalan wasn’t an outside hire. He was an inside-the-family transfer from Deutsche Telekom, moved from running Germany to COO at T-Mobile US with the explicit understanding he was the successor. Verizon doesn’t have a European parent to draw from, so it has to recruit externally from that same talent pool. Given the CEO audition dynamic, the candidate needs to be someone who has already won competitive battles at scale. There’s no time for on-the-job learning. The FT reported headhunters are already active. Schulman needs that person in the consumer seat by mid-2026. Identifying and onboarding such a high caliber candidate in such a compressed time is extremely difficult.

The Immediate Math

Near-term operational risk is manageable. Villanueva owns both the transformation portfolio and the consumer P&L, eliminating finger-pointing during restructuring. The new value proposition launches in H1 2026. The longer-term risk is strategic: the $20 billion Frontier acquisition needs consumer-side integration, FWA grew to 5.7 million combined subscribers, Fios internet hit 7.3 million, and total broadband topped 13.6 million. Each growth vector requires a permanent consumer leader with deep telecom operating experience. Villanueva was hired for transformation, not operations.

Verizon’s Consumer Group has turned over its leader four times in seven years. Dunne served five years and built the 5G consumer strategy. Brouillette lasted less than one. Sampath stabilized the business over two years but wasn’t Schulman’s pick. Villanueva is holding the seat with ten weeks of Verizon experience. Every transition resets institutional momentum, disrupts middle management, and gives competitors a window. The revolving door is itself a competitive disadvantage, and it compounds: each new leader inherits not just the business challenges but the organizational scar tissue from the last transition.

Schulman and Villanueva are the rescue team. They’ll stabilize and restructure. But they’re not the long-term answer, even as timelines will be slipping. The next Consumer Group CEO hire is the most consequential personnel decision Verizon will make this year, because that person is almost certainly being positioned to eventually run the whole company, and because an executive auditioning for that job will compete with an intensity Verizon hasn’t shown in years. The non-compete constraints, the Dunne precedent, and the active headhunter outreach all point to Europe. Get it right, and Verizon’s competitors face a newly dangerous opponent backed by the largest network in the country. Get it wrong, and the revolving door spins again.


The U.S. wireless industry has officially entered a new era, catalyzed by a landmark transaction that confirms the final collapse of EchoStar’s long-held ambition to become a fourth facilities-based carrier. EchoStar has entered into a definitive agreement to sell its complete portfolio of prized AWS-4 and H-block spectrum licenses to SpaceX for approximately $17 billion. The deal, consisting of up to $8.5 billion in cash and an equivalent amount in SpaceX stock, also includes a provision for SpaceX to fund approximately $2 billion of EchoStar’s debt interest payments through late 2027 and establishes a long-term commercial agreement for SpaceX to provide its next-generation Starlink Direct-to-Cell (D2C) service to EchoStar’s Boost Mobile subscribers.

This agreement is not merely a corporate restructuring; it is the definitive end of a regulatory dream and the formal beginning of a new, more complex competitive paradigm. The transaction solidifies the U.S. terrestrial wireless market as a stable, three-player market while simultaneously igniting a new, asymmetric competitive front in satellite-to-cellular connectivity. SpaceX, now armed with dedicated, purpose-built spectrum for Mobile Satellite Service (MSS), and its primary terrestrial partner, T-Mobile, possess a significant first-mover advantage in the race for ubiquitous coverage. This move elevates the D2C value proposition from a niche, emergency-only feature into a core, marketable network attribute.

The cascading effects of this deal will reshape the strategies of every major player for years to come. For EchoStar, it marks the final pivot from a would-be network operator to a “hybrid MVNO” and a significant shareholder in SpaceX, a stunning financial victory for its chairman, Charlie Ergen, born from the ashes of operational failure. For Verizon and AT&T, it provides urgency to accelerate their own D2C counter-strategy with partner AST SpaceMobile. Finally, the transaction presents a novel challenge for regulators. The review will be forced to look beyond traditional concerns of terrestrial spectrum consolidation and grapple with the profound implications of SpaceX’s vertical integration, examining its dominance in the satellite launch market and its new, powerful position in the downstream market for satellite connectivity services. The two-front war has begun.

I. The Deal That Ends an Era: Deconstructing the EchoStar-SpaceX Agreement

The definitive agreement between EchoStar and SpaceX represents one of the most significant strategic transactions in the recent history of the U.S. telecommunications sector. Its architecture reflects the unique financial positions and strategic imperatives of both companies, transferring a uniquely valuable set of spectrum assets that will power a new generation of satellite services and formalizing a commercial alliance that provides a lifeline to a struggling wireless brand.

Financial Architecture and Valuation Analysis

The transaction is structured to provide EchoStar with immediate financial relief and long-term upside, while allowing SpaceX to acquire a critical strategic asset without depleting its capital reserves needed for its ambitious launch and satellite manufacturing programs. The core terms of the agreement are as follows :

  • Total Consideration: The deal is valued at approximately $17 billion.
  • Cash Component: SpaceX will provide up to $8.5 billion in cash.
  • Stock Component: SpaceX will provide up to $8.5 billion in its own stock, with the valuation fixed as of the date the definitive agreement was signed.
  • Debt Servicing: In a crucial provision that addresses EchoStar’s immediate liquidity crisis, SpaceX has agreed to fund an aggregate of approximately $2 billion in cash interest payments due on EchoStar’s substantial debt through November 2027.

This 50/50 cash-and-stock structure is a work of strategic financial engineering. A pure cash deal of this magnitude would place immense strain on SpaceX, a company with massive and continuous capital expenditures for its Starship development and Starlink constellation deployment. Conversely, a pure stock deal would have been unacceptable to EchoStar’s creditors, who require cash to service the company’s more than $26.4 billion in total debt. The balanced split provides an elegant solution. SpaceX preserves vital capital for its core operations, while EchoStar secures sufficient immediate liquidity to manage its most pressing debt obligations and stabilize its financial footing.

Furthermore, by accepting a significant equity stake in one of the world’s most valuable private companies, EchoStar Chairman Charlie Ergen has transformed what could have been a simple liquidation of assets into a long-term investment. This move aligns the financial interests of both parties in the success of the D2C venture that this very spectrum will empower. It gives EchoStar and its shareholders continued participation and upside potential in the high-growth satellite connectivity ecosystem, effectively hedging the sale of its own ambitions against the success of its acquirer.

Asset Deep Dive: The Strategic Value of AWS-4 and H-Block Spectrum

The intense pursuit of these specific licenses by SpaceX was driven by the unique and irreplaceable nature of the AWS-4 band. While the H-block licenses are a valuable addition, the AWS-4 spectrum—encompassing the 2000-2020 MHz uplink and 2180-2200 MHz downlink bands—is widely considered the “golden band” for D2C services.

Its value stems from its history and technical characteristics. Unlike repurposed terrestrial spectrum, such as the sliver of T-Mobile’s PCS G-block currently used for the beta T-Satellite service, the AWS-4 band was originally allocated for Mobile Satellite Service (MSS). The propagation physics of both bands are ideal for the challenges of space-to-ground communication, making it far more efficient for connecting satellites to standard smartphones. More importantly, its existing regulatory framework as an MSS band provides a more direct and less contentious path for satellite use, sidestepping many of the complex technical and legal challenges associated with using terrestrial-designated bands from space under the FCC’s new Supplemental Coverage from Space (SCS) framework.

By acquiring the entire portfolio of these licenses, SpaceX secures exclusive, nationwide rights to this optimal spectrum. This acquisition is transformative, enabling SpaceX to develop and deploy a next-generation Starlink D2C constellation capable of moving beyond the limitations of the current text-only service. With dedicated, purpose-built spectrum, SpaceX can now credibly pursue its roadmap of offering reliable voice, streaming-grade data, and robust IoT capabilities directly to unmodified smartphones, a quantum leap in service capability.

The Commercial Alliance: Defining the Future of Boost Mobile and Starlink D2C

A core component of the definitive agreement is the establishment of a long-term commercial alliance. This partnership will enable EchoStar’s Boost Mobile subscribers to access SpaceX’s next-generation Starlink D2C service, with the connection being managed through Boost’s own cloud-native 5G core network. While seemingly a straightforward value-add for customers, this commercial agreement serves multiple, layered strategic purposes for both companies and for the deal’s regulatory prospects.

For EchoStar, the alliance provides a desperately needed lifeline and a unique point of differentiation for its struggling Boost Mobile brand. Facing relentless subscriber losses and the decommissioning of its own physical network, Boost can now market a truly innovative feature—ubiquitous satellite connectivity—to stanch churn and potentially attract new customers in the hyper-competitive prepaid market. It allows EchoStar to maintain a narrative of being a technology-forward competitor even as it fully transitions to a “hybrid MVNO” model, reliant on the networks of its rivals. It still does not solve Boost Mobile’s remarkable inability to sell its services successfully.

Most critically, this commercial component is a masterful piece of regulatory strategy. The preservation of Boost Mobile as a distinct competitive entity, now enhanced with a unique satellite offering, provides essential political cover for the transaction. It allows the Department of Justice (DOJ) and the Federal Communications Commission (FCC) to approve a deal that otherwise permanently cements a three-player terrestrial market. Regulators can plausibly argue that they have preserved a “fourth wireless competitor,” even if that competitor no longer owns a radio access network. This framework directly mirrors the “hybrid MNO” model established in EchoStar’s prior spectrum sale to AT&T, creating a consistent and defensible regulatory precedent that will ease the path to approval.

II. EchoStar’s Final Chapter: From Contender to Catalyst

The sale of EchoStar’s most valuable spectrum assets was not a strategic choice but an inevitability, the culmination of years of financial strain, commercial missteps, and overwhelming regulatory pressure. The company’s journey from a government-mandated fourth carrier to a motivated spectrum broker is a stark cautionary tale about the brutal economics of the modern wireless industry. Yet, for its chairman, it represents the profitable conclusion to a decades-long speculative bet.

Anatomy of a Forced Sale: Financial Distress, Network Failure, and Regulatory Pressure

The fire sale of EchoStar’s spectrum was precipitated by a combination of three fatal blows that left the company with no viable path forward other than liquidation.

First, the company’s financial position had become untenable. Saddled with a total debt load exceeding $26.4 billion, EchoStar reported a net loss of $306 million in the second quarter of 2025 alone. The financial distress grew so acute that the company began missing multi-million dollar interest payments, a clear signal of a looming liquidity crisis. The post-pandemic rise in interest rates had closed the window for the cheap financing necessary to fund a nationwide network buildout, leaving the company hemorrhaging cash from its wireless division and presiding over a legacy pay-TV business in secular decline. The inclusion of a $2 billion interest payment provision by SpaceX in the final deal underscores the severity of this financial pressure.

Second, EchoStar’s flagship strategic initiative, a technologically advanced, greenfield 5G Open RAN network, was a commercial catastrophe. Despite earning technical praise for its rapid deployment, the network failed to attract a critical mass of subscribers, becoming a “ghost town” that generated no meaningful revenue or positive cash flow. This failure proved that simply building a network is not synonymous with building a successful wireless business. The surrender was signaled definitively when the company laid off 90% of its wireless engineering organization following its initial spectrum sale to AT&T, an irreversible move away from any serious network ambitions.

Finally, the FCC, under Chairman Brendan Carr, delivered the coup de grâce. Prompted by public questions from Elon Musk about why EchoStar was allowed to hold valuable spectrum without fully utilizing it, the commission launched a high-profile campaign against the company’s “spectrum squatting”. This regulatory pressure, amplified by relentless lobbying from SpaceX, initiated formal inquiries into EchoStar’s buildout compliance and effectively froze the company’s ability to raise capital. Cornered financially and regulatorily, Chairman Charlie Ergen was forced to abandon his decades-long strategy of hoarding spectrum, leaving a sale as his only remaining option. Both the AT&T and SpaceX deals are explicitly framed by EchoStar as necessary steps to resolve these pending FCC inquiries.

The Definitive Pivot: Termination of the MDA Space Contract

If any doubt remained about EchoStar’s complete and total surrender of its network infrastructure ambitions, it was erased by a single, decisive action that occurred concurrently with the SpaceX deal announcement. On September 8, 2025, EchoStar issued a termination for convenience notice to MDA Space for a major satellite constellation contract that had been announced just five weeks prior, on August 1, 2025.

This sequence of events reveals the stark, binary choice the company faced. The initial MDA Space contract was a bold statement of intent, committing EchoStar to a multi-billion dollar project to build its own Low Earth Orbit (LEO) satellite constellation for D2D services, positioning itself as a direct competitor to Starlink. It was the “build” path. The subsequent termination, explicitly cited as the result of a “sudden change to EchoStar’s business strategy and plan in the wake of spectrum allocation discussions with the Federal Communications Commission,” was the definitive pivot to the “sell” path. This was not a gradual strategic evolution but an abrupt reversal. The deal with SpaceX made building its own constellation both unnecessary and impossible. The termination of the MDA contract is the final, irrefutable evidence that EchoStar has permanently exited the network infrastructure business, both on the ground and in space.

The Financial Epilogue for Ergen: A Masterclass in Spectrum Arbitrage

Despite the spectacular operational failure of the fourth-carrier project, the great spectrum reshuffle represents an immense financial victory for Charlie Ergen. Over several decades, he masterfully acquired a vast portfolio of spectrum licenses, often at prices far below today’s market value. The recent sales are the culmination of this long-term arbitrage strategy.

The August 2025 sale of 600 MHz and 3.45 GHz spectrum to AT&T netted approximately $23 billion, a price tag roughly $9 billion higher than what EchoStar originally paid for those licenses. Combined with the approximately $17 billion transaction with SpaceX, the total proceeds from the spectrum liquidation will be around $40 billion. This sum is more than sufficient to retire EchoStar’s entire $26.4 billion debt load, with a substantial multi-billion dollar profit remaining for Ergen and the company’s shareholders. While his dream of being a wireless network king is dead, the poker player has walked away from the table with the jackpot.

III. Starlink’s Quantum Leap: Forging a New Satellite-Terrestrial Paradigm

The acquisition of EchoStar’s AWS-4 and H-block spectrum is a watershed moment for SpaceX. It catapults the company’s Starlink division from a promising but niche player in the D2C space into a position of formidable power, armed with the ideal assets to realize its global ambitions. This deal fundamentally alters the D2C value chain, supercharges its alliance with T-Mobile, and introduces complex new questions of vertical integration for antitrust regulators.

From Partner to Kingmaker: The Power of Dedicated MSS Spectrum

Until now, Starlink’s D2C service, offered in partnership with T-Mobile, has been a groundbreaking but technically constrained offering. It has operated by leasing a small slice of T-Mobile’s terrestrial PCS spectrum, a band not optimized for the physics of space-to-ground communication. This has limited the service to basic text messaging, with a roadmap for voice and data still in development.

The acquisition of dedicated, nationwide MSS spectrum changes everything. As previously noted, the AWS-4 band is purpose-built for satellite communications, offering superior performance and a clearer regulatory path. Owning this “golden band” allows SpaceX to transition from a D2C partner, reliant on a carrier’s terrestrial assets, to a D2C kingmaker that controls its own destiny. With exclusive rights to this spectrum, SpaceX can now engineer a fully optimized, next-generation satellite constellation designed to deliver on the full promise of D2C: reliable voice, high-quality data streaming, and ubiquitous IoT connectivity directly to standard smartphones. This elevates the D2C value proposition from a novelty or emergency feature into a core, marketable network attribute, fundamentally changing the competitive landscape.

The T-Mobile Alliance Supercharged: Forging a “Ubiquity Moat”

The most immediate beneficiary of SpaceX’s empowerment is its primary U.S. partner, T-Mobile. The combination of T-Mobile’s extensive terrestrial 5G network and Starlink’s enhanced D2C capabilities creates a hybrid network with a profound competitive advantage. T-Mobile will soon be able to market a service that offers virtually seamless connectivity, eliminating terrestrial dead zones for core voice and data services across the vast majority of the U.S. landmass.

This capability directly addresses a primary consumer pain point and a top purchase driver: the ability to make calls and use data anywhere. This “ubiquity” feature becomes a formidable competitive moat. It creates a stickier service that could significantly reduce customer churn, particularly among high-value subscribers in rural areas, outdoor enthusiasts, and enterprise clients in sectors like logistics, agriculture, and transportation. It provides a compelling reason for customers of rival carriers to switch to T-Mobile and a powerful reason for existing customers to stay. While the service will have inherent limitations, satellite signals struggle to penetrate buildings, confining the primary use case to outdoor environments, its value in eliminating outdoor dead zones gives T-Mobile an asymmetric advantage that rivals, with their still-nascent D2C partnerships, cannot immediately match.

Antitrust Headwinds: Scrutinizing the Vertical Integration of a New Power Broker

While the transfer of spectrum licenses from a non-competitor (EchoStar) to a new entrant (SpaceX) may not trigger traditional horizontal antitrust concerns, the deal’s approval is not guaranteed. It is highly unlikely that the FCC or DOJ will put significant conditions on this deal even though it raises a more complex and potentially more problematic issue: vertical integration and the market power of SpaceX.

The structure of this transaction creates a classic vertical integration scenario that will force antitrust authorities to consider novel questions in the telecommunications space. SpaceX is already the dominant player in the upstream market for satellite launch services, controlling a vast majority of the global commercial launch market. Many of its direct competitors in the satellite communications industry, including companies building rival D2C constellations, are dependent on SpaceX’s rockets to get their satellites into orbit. This reliance has already raised concerns about SpaceX potentially favoring its own Starlink constellation.

By acquiring scarce, premium MSS spectrum, SpaceX is now poised to become the dominant player in the downstream market for D2C services in the U.S. This combination of upstream and downstream market power will compel antitrust enforcers to examine whether SpaceX could leverage its launch monopoly to harm competition in the D2C market. This could manifest in several ways consistent with a classic “raising rivals’ costs” antitrust theory, such as using discriminatory pricing for launches, prioritizing its own satellites over those of competitors, or demanding exclusionary contract terms that limit a customer’s ability to use other launch providers. This shifts the regulatory focus from the FCC’s public interest standard on spectrum utilization to the DOJ’s stricter antitrust framework concerning market power, competitive foreclosure, and the potential for a dominant firm in one market to stifle competition in an adjacent one.

IV. The Terrestrial Counteroffensive: AT&T and Verizon’s Race for Parity

While the SpaceX-EchoStar deal reshapes the satellite-cellular frontier, the battle on the terrestrial front continues unabated. For Verizon, the imperative to secure additional mid-band spectrum is now more acute than ever, though its path is complicated by legal disputes. In response to the formidable T-Mobile/Starlink alliance, Verizon and AT&T have been forced into an unprecedented defensive partnership, betting their D2C future on a single satellite provider, AST SpaceMobile.

The Strategic Imperative for AWS-3 and the Shadow of a Lawsuit

Verizon’s network has long been defined by its quality and reliability, but it faces a relative deficit in critical mid-band spectrum compared to T-Mobile’s vast 2.5 GHz holdings. AT&T’s recent $23 billion acquisition of EchoStar’s 3.45 GHz and 600 MHz spectrum threatened to widen this gap, potentially leaving Verizon in third place in the 5G capacity race.

However, this straightforward strategic move is complicated by a significant legal entanglement. EchoStar is currently suing the FCC in the U.S. Court of Appeals for the Tenth Circuit to block the rules governing the upcoming re-auction of these very AWS-3 licenses. The lawsuit stems from a decade-old issue where Dish Network (now EchoStar) defaulted on winning bids from the original 2015 auction. EchoStar is now potentially liable for any shortfall if the re-auction fails to generate at least $3.3 billion. EchoStar argues that the FCC’s updated, more restrictive auction rules for small businesses will suppress bidding, making a shortfall more likely and unfairly exposing the company to billions in penalties.

This litigation creates a strategic dilemma that directly impacts the competitive balance. The lawsuit introduces significant uncertainty around the timing and final cost of the AWS-3 spectrum, which Congress has mandated must be auctioned by June 2026. Any delay in the auction directly harms Verizon’s ability to close its mid-band capacity gap with AT&T, which has already secured and can begin deploying its new spectrum. Every month the AWS-3 spectrum remains in legal limbo is a month that Verizon’s network risks falling further behind in critical urban markets, eroding the very foundation of its premium brand and value proposition.

The AST SpaceMobile Gambit: A Unified Front Against a Common Threat

Faced with the powerful and vertically integrated T-Mobile/Starlink alliance, Verizon and AT&T have been driven to adopt an unprecedented counter-strategy: a joint, non-exclusive reliance on satellite partner AST SpaceMobile. Both carriers have signed commercial agreements with AST SpaceMobile and are providing it with access to their licensed terrestrial spectrum—primarily in the 850 MHz band—to power its D2C service.

This move represents a fundamental shift in the competitive dynamics of the U.S. wireless market. AT&T and Verizon are historically fierce, zero-sum competitors that have rarely, if ever, collaborated on a core strategic technology platform. Their decision to both partner with AST SpaceMobile, rather than each seeking an exclusive satellite partner, is a clear signal of the profound disruptive threat they perceive from Starlink. This “co-opetition” is a defensive alliance born of necessity. By pooling their spectrum resources and committing their vast subscriber bases to a single satellite platform, they can help AST SpaceMobile achieve the scale, funding, and regulatory momentum necessary to build a viable competing constellation more quickly. This strategy effectively transforms the D2C battle from a three-way free-for-all into a two-sided war between distinct technology ecosystems: the T-Mobile/Starlink bloc versus the AT&T/Verizon/AST SpaceMobile bloc.

Comparative Analysis: Starlink D2C vs. AST SpaceMobile

The two emerging satellite-cellular ecosystems are built on fundamentally different strategic and technical models.

  • The Starlink Model: This is a deeply vertically integrated approach. SpaceX controls the rocket manufacturing, the launch services, the satellite constellation, and now, the dedicated MSS spectrum. This provides significant advantages in terms of cost control, deployment speed, and the ability to optimize the entire system—from satellite to spectrum to handset—for maximum performance. Its primary challenge is the immense capital required to build and maintain this integrated system.
  • The AST SpaceMobile Model: This is a partnership-based approach. AST SpaceMobile relies on its carrier partners (AT&T and Verizon in the U.S.) for access to terrestrial spectrum and their subscriber bases. Its key technological differentiator is its satellite design, which features exceptionally large phased-array antennas. These massive antennas are designed to be powerful enough to connect directly with standard, unmodified smartphones using conventional terrestrial spectrum bands from hundreds of miles in orbit. This model is more capital-efficient for the satellite operator but introduces complexities in coordinating with multiple carrier partners and managing potential interference with terrestrial networks.

The race is now on to see which model can achieve scale and deliver a compelling service to consumers first. Starlink has the advantage of an existing LEO constellation and now, superior spectrum. AST SpaceMobile has the backing of two of the world’s largest carriers and a novel satellite architecture. The outcome of this technological and strategic competition will define the future of ubiquitous connectivity. Alternatively, AT&T and/or Verizon could abandon their AST SpaceMobile partnership and throw in their lot with Starlink. This might be a technically superior solution, but puts them at the mercy of Elon Musk.

V. Navigating the Regulatory Gauntlet

The final approval of the EchoStar-SpaceX spectrum transfer is not a foregone conclusion and must navigate a complex regulatory environment. However, the deal has been skillfully structured to address the primary concerns of the FCC, while the most likely challenge will come from state-level actors seeking consumer protection concessions.

The FCC’s End Game: Why Approval Is the Path of Least Resistance

The FCC is highly likely to approve the spectrum license transfer with minimal friction. The entire transaction is framed as the solution to the very problem that prompted the agency’s investigation in the first place: EchoStar’s perceived “spectrum squatting”. For years, and with increasing public pressure from figures like Chairman Carr, the FCC’s primary objective has been to see EchoStar’s underutilized spectrum put to more intensive use for the benefit of American consumers.

This deal achieves that objective in the most direct way possible. It transfers the licenses from EchoStar, a company that proved unable to deploy them effectively, to SpaceX, a well-capitalized and highly motivated entity that has publicly committed to building a next-generation satellite network on these exact frequencies. For the FCC, approving the deal is the path of least resistance; it allows the commission to declare victory in its campaign against spectrum warehousing. The preservation of Boost Mobile as a “hybrid MNO” with access to this new D2C service provides the necessary political and regulatory justification to bless the transaction.

DOJ and State AGs: The Inevitable Price of Consolidation

While the FCC’s path seems clear, the view from antitrust enforcers is more complex. The Department of Justice is unlikely to block the transaction outright. The “failing firm” doctrine, which was a key rationale in the approval of the T-Mobile/UScellular merger, applies directly to the collapse of EchoStar’s wireless ambitions. With EchoStar having effectively exited the market as a facilities-based competitor, the DOJ lacks a strong basis to argue that this specific spectrum transfer further harms terrestrial competition. The more salient antitrust questions, as noted, relate to vertical integration, which may result in behavioral remedies or oversight rather than a full blockade.

The most probable challenge will emerge from a multi-state coalition of Attorneys General, particularly from Democratic-led states. This is the same playbook used during the T-Mobile/Sprint merger, where state AGs filed suit to block the deal on consumer protection grounds, arguing it would reduce competition and raise prices. A similar legal challenge is almost inevitable. The AGs will argue that allowing the last major independent block of mid-band spectrum to be absorbed into an ecosystem controlled by one of the top three carriers’ partners permanently cements a three-player oligopoly to the detriment of consumers.

However, the most likely outcome of such a challenge is not a complete blockade but a negotiated settlement. Precedent suggests that the carriers will be forced to the negotiating table to offer tangible consumer concessions in exchange for the AGs dropping their lawsuit. These concessions could include multi-year price locks for low-income plans, specific buildout commitments for the D2C service in underserved rural areas within their states, and robust protections for independent Mobile Virtual Network Operators (MVNOs) to ensure a competitive wholesale market. The deal will proceed, but not without a price.

VI. Conclusion: Winners, Losers, and the Future Trajectory of U.S. Connectivity

The great spectrum reshuffle, culminating in the EchoStar-SpaceX transaction, has irrevocably altered the competitive landscape of the U.S. telecommunications and satellite industries. It has created clear winners and losers, solidified a new market structure, and set the strategic trajectories for every major player for the remainder of the decade.

Scoring the Reshuffle:

The definitive terms of the recent deals allow for a clear assessment of the strategic outcomes for all involved parties.

  • Biggest Winners: The clearest victors are Charlie Ergen and SpaceX. Ergen successfully monetized decades of spectrum speculation for a massive profit, deftly navigating operational failure to achieve a stunning financial success. SpaceX acquires the “golden band” of MSS spectrum, the single most critical and previously unobtainable asset needed to realize its global D2C ambitions and establish a commanding technological lead.
  • Primary Beneficiary: T-Mobile emerges as the primary strategic beneficiary among the mobile network operators. Its exclusive partnership with a newly empowered Starlink provides it with a powerful and asymmetric “ubiquity moat”—a unique value proposition of near-total coverage that will be a potent tool for customer acquisition and retention in the years to come.
  • Forced to React: Verizon and AT&T are now firmly on the defensive in the new D2C battle. While their terrestrial network positions are solidified—particularly AT&T’s after its own spectrum purchase from EchoStar—they have been forced into a reactive alliance with AST SpaceMobile to counter the first-mover advantage of the T-Mobile/Starlink bloc. Their success now depends heavily on the execution of a third-party partner in a race where they are starting from behind or they might join the Starlink camp under the premise of “If you can’t beat them, join them.”
  • Biggest Losers: The most significant casualty is the concept of a fourth facilities-based U.S. wireless carrier. The collapse of EchoStar’s effort, despite government mandates and access to spectrum, proves that the economic and competitive barriers to entry are now insurmountably high. EchoStar, the company, also fits this category. While financially solvent, its grand ambitions are dead. It survives as a shell of its former aspirations, relegated to the role of a hybrid MVNO presiding over a satellite TV business in terminal decline.

The Evolving Battlefield: Key Milestones and Strategic Outlook for 2026-2028

The U.S. wireless market now revolves around three titans engaged in a two-front war. The coming years will be defined by their execution on both the terrestrial and satellite fronts. The key milestones that will determine the future trajectory of the industry include:

  • The timeline and outcome of the regulatory review for the SpaceX/EchoStar transaction, including any potential concessions demanded by State Attorneys General.
  • The resolution of EchoStar’s lawsuit against the FCC and the subsequent timing and results of the AWS-3 spectrum re-auction, which will be critical for Verizon’s 5G capacity strategy.
  • The initial commercial launch and real-world performance of Starlink’s enhanced D2C service operating on the AWS-4 spectrum, which will be the first major test of the technology at scale.
  • The successful launch and operational performance of AST SpaceMobile’s first block of commercial BlueBird satellites, which will determine the viability of the AT&T/Verizon counter-strategy.
  • The marketing, pricing, and consumer adoption rates of the competing D2C offerings, which will ultimately reveal whether ubiquitous connectivity is a niche feature or a mass-market demand driver that can reshape carrier loyalty.

The era of four-player competition is definitively over. The war for the future of American connectivity—a war fought simultaneously on the ground and from orbit—has just begun.


5G fixed wireless access (FWA) is transforming how Americans are accessing the internet. In less than three years, 7.9 million customers signed up with FWA as their preferred internet solution. Recon Analytics interviewed more than 40,000 home internet customers in the first 12 weeks of the year and the results are clear: FWA customers are happier with their service than with service through any other technology. The only thing standing in the way of greater success is more capacity, which is why mobile operators are clamoring for more licensed full-power spectrum.

Chart 1:

FWA is the clear winner across the board

The ranking in Chart 1 makes sense, but is surprising at the same time. The mobile network operators built a very robust offering. FWA is not the fastest service, but under the current usage parameters it satisfies its customers not only on the traditional product side such as easy and convenient installation, a superior router experience, delivering an easy-to-understand bill, and online self-help customer service that people actually like, but also on the service side, ranging from the internet usage categories, to support over the phone and, most importantly, value for money.

It is important to keep in mind that there is a double bias going on with FWA customers. First, the vast majority of FWA customers have the same provider for their mobile service. Customers who are unhappy with their mobile service do not select the same provider and network for their home internet service. Second, there is a survivorship bias. Customers who sign up with FWA typically do this while they are still using a previous service with which they are unhappy. It is very easy and convenient to install and, if necessary, to return the FWA router and cancel the service, so prospective customers give it a try and take advantage of the cancellation poicy if it doesn’t work. We have a hard time finding  customers who try the service and are unhappy with it, but have not returned it yet.

Customer service and connectivity

Chart 1 also reiterates what we have known for a long time: cable companies have poor customer service and need to improve. Telecom providers who are phasing out DSL networks and focusing on fiber provide substantially better customer service. What might surprise people is the strong performance of satellite service. This is mostly driven by Starlink, which is getting successively better over time, as a provider of last resort for many of its customers.

Recon Analytics also asks its home internet respondents every week what kind of issues they experienced with their internet connection. Chart 2 is ordered top to bottom with how often respondents experienced an outage. The most common issue, which was internet connection going down, is at the bottom. Furthermore, it is also ordered from left to right by how often they experienced their internet connection going down.

Chart 2:

As we can see in Chart 2, most of the issues are in one of two groups: internet connection going down or slowing down, and router issues forcing people to reset their router or having devices disconnect from the network.

Cable providers had the most issues in all four categories. Up to 43% of respondents reported that their internet connection has been interrupted, while fiber and FWA customers reported the least problems in this category. The newer, better routers provided by fiber and FWA providers also caused fewer problems compared to the routers from cable companies and DSL providers. One fiber and DSL provider told me that once they went away from sourcing the cheapest router to providing an excellent router, it was a game changer for them. The change reduced customer service calls and churn and improved customer satisfaction, more than offsetting the cost of the better router.

How to create more and better home internet choices

As of right now, the Congress and the FCC have created meaningful competition through up to three new providers with up to four brands in the markets where mobile network operators have been able to launch their service. It is incredible that even though we have seen network speeds for some providers decrease from 200 and more Mbps to low 100s Mbps, cNPS scores have not declined. MNOs still have enough capacity to provide their customers with sufficient bandwidth for what customers describe as a superior experience. Verizon and T-Mobile said that they have enough capacity for 5 and 7 million customers respectively with their initial FWA build. They are two thirds to that goal and will probably reach it by the end of 2024. After that, it will become more difficult and expensive to find the necessary capacity to compete with cable and DSL providers as vigorously as they do today. FWA is the fastest growing segment of the home internet market, while cable subscriptions are decreasing.

The government has three options, but the choice is pretty clear: It can spend $80 billion on various fiber incentive programs (BEAD, RDOF, etc) to bring another provider to markets where there is no provider offering more than 100 Mbps speed. It can take $80 billion from the wireless carriers for more spectrum (C-Band Auction for 240 MHz yielded $81 billion) and get three new broadband competitors in the form of FWA providers. Or, it can do both and create more and better home internet choices for Americans with a net zero cost.

By Daryl Schoolar, Sanjay Mewada

During the last week of September, GSMA, along with its partner CTIA, held their annual North America conference in Las Vegas. Given the regional focus of the conference, the news and activity coming from it pales in comparison to the Barcelona version. However, that does not mean MWC Las Vegas is without value. We had several meetings that alone made the event worth attending. Plus, some companies still use the conference as a platform for announcements, while the exhibit floor provides guidance on the state of mobile communications in North America.

Of the major U.S. mobile network service providers only T-Mobile and AT&T had a show floor presence this year, but that did not mean other mobile providers didn’t make their presence know. Some of the operator highlights and messages from MWC Las Vegas 2023 are as follows:

AT&T: The company’s booth was dedicated to enterprise solutions, with connected vehicles occupying significant space. This is fitting given that Hardmon Williams, SVP, Connected Solutions for AT&T, used his keynote session to announce the company is now the connectivity provider for electric car manufacturer Rivian. Hardmon also discussed the frequent software updates of electric cars, which in turn increases the importance of network connectivity to support those updates.

MobileX: The competitive outlook for the U.S. prepaid market should intensify with the announcement by MobileX that it will launch a prepaid service exclusively through a retail partnership with Walmart. The driving force behind MobileX is Peter Adderton who has a track record of launching successful prepaid brands with Boost in the U.S. and Australia. Walmart’s interest in working with MobileX appears to be a competitive move against its online rival Amazon and its recently announced sales partnership with Dish’s Boost offering.

NTT DoCoMo: On the first day of the show the Japanese mobile operator announced it will be deploying an Open vRAN solution using NVIDIA GPU for hardware acceleration. NVIDIA will be supporting both the X86 and the ARM architecture. This is significant, as it not only gives NVIDIA a major Open RAN win, but will help overall create more Open RAN deployment options.

T-Mobile: The established U.S. mobile operator T-Mobile captured the most attention at the show with its announcement of a SIM based SASE offering using network slicing. This marks the first commercial service offering using 5G network slicing in the U.S. T-Mobile’s slicing will go commercial later this year. This is an important step in 5G evolution, helping to prove commercial viability of slicing. To help grow slicing, T-Mobile CTO John Saw announced that the company has made network slicing available nationwide to application developers. T-Mobile also took full advantage of the exhibit floor to show multiple wireless enterprise solutions and to host public sessions inside its booth. It was one of the liveliest spots on the floor.

Verizon: Verizon did not make any specific service announcements at MWC Las Vegas, but it did release a statement at the start of the conference highlighting its progress in transforming its network and the subsequent benefits. Those highlights included fiber network investments, mid-band and mmWave spectrum coverage, 5G fixed wireless access, and cloud-native network transformation. Verizon Business CEO Kyle Malady used his time on stage at MWC to push back against FCC’s plan to reintroduce Net Neutrality, as a solution looking for a problem that does not exist. b

Of the three largest RAN suppliers in the region, only Nokia was on the floor. However, that doesn’t mean the conference lacked an infrastructure presence. Some of our vendor observations from the conference are as follows:

AWS: The company had a substantial presence on the show floor. Booth space was primarily dedicated to meetings and educational conversations regarding AWS’ telecom service provider and enterprise solutions. Digital transformation, and the role AWS can play in helping mobile operators with their transformation remains a strategic interest. Supporting that strategy, Sameer Vuyyuru, head of WW business development for communication service providers, gave a keynote presentation about how mobile operators are using GenAI to improve operations and customer experience.

Dell Technologies: From Dell’s hospitality suite overlooking the show floor the company promoted itself as the best option for operators looking for an IT hardware partner for building cloud-native networks. This includes servers to support Open RAN. Dell also participated in a private network demonstration with Airspan, Dish Networks, and Druid.

Nokia: As a sign of the shifting nature of network infrastructure, hardware specialist Nokia used its time at MWC Las Vegas to talk about software. Its message at the conference was “Network as Code” and participated in the open developer gateway conference held at the show. Nokia was also found at the GSMA booth demoing virtual reality to help drive interest in the mobile API opportunities.

Pivotal Commware: Pivotal Commware continues to focus on how to improve 5G mmWave economics through coverage extension and network planning and management tools. The company continues to make progress in this area indicating an increase in its U.S. deployments and that it is seeing its commercial opportunities expanding beyond the U.S.

Qualcomm: The company showed together with Quectel a 5G cellular module for laptops that can aggregate cellular and Wi-Fi signals. This is a nifty capability that focuses on the best performing link. In addition, Qualcomm continued its tradition of educating analysts about new market developments and technological innovations.

Beyond the specific vendors listed above, a significant percentage of vendor booth space remains dedicated to IoT, FWA, private networks, and indoor coverage solutions.

Realistically the U.S. version of MWC will never rival the Barcelona one. The U.S. version is mainly for North American operators and vendors while the one in Spain is global. That focus reduces participation. Vendors can bypass the show and still meet with customers and prospects. However, this does not mean the show should be written off. It remains a good source for one-on-one interactions and as a mid-year gauge of industry growth since Barcelona.

Recon Analytics recently conducted the largest survey run to date to assess whether consumers eligible for the Affordable Connectivity Program (ACP) are actually enrolling and if so, what they are using their ACP funds for.  

We conducted nationwide consumer surveys among ACP-eligible Americans from April 28 – May 5, and August 18 – 27, 2023. We asked 29,141 ACP eligible Americans if they use ACP, and if so for what. 

We were not at all surprised with our survey findings, but some policymakers might be.

Recall that ACP is a program that provides “eligible” Americans $30 per household for internet connectivity.  Who is eligible?  Figure 1 sets forth the categories of citizens eligible for ACP.  These “categories” of low income individuals are from existing federal government subsidy programs.

Figure 1

Of the almost 53 million ACP-eligible households, more than 20 million have signed up. The states with the highest number of consumers receiving ACP subsidies are “red” states Louisiana, Ohio, Kentucky, and North Carolina.  

The program is currently set to expire in early 2024 absent additional funding by Congress.The big question inside the Beltway is whether funding the ACP is a good use of taxpayer dollars.  The ReconAnalytics survey indicates that if Congress is interested in seeing itself reelected, extending the ACP funding might be a good idea.

The Data Says ACP is Working to Close the Digital Divide … Among Republican Voters

When we compare ACP enrollment across red states and blue states (defined by the party who won the last senatorial election in the state) , we observe that the percentage of households which would lose access to the internet is higher in red states than in blue.  39% of ACP enrollees live in Red States and  34% live in blue states.  Members of Congress ignore this reality at their peril.

But what about the enrollees, what are they using their ACP subsidy for?  Consider that the largest proportion of households at risk of losing ACP are ones with school-age children.  No surprise then that our survey reveals that these same households use their ACP subsidy for school work online.

In aggregate, about 55% of respondents who told us they would be unable to access the internet without ACP were white, 16% Hispanic, 12% black, 9% Asian, 6% Native American or Pacific Islanders and 2% were of another race.

Figure 2 – ACP Enrollees by Race, Ethnicity, Age and Income Distribution

Full Time Period     
Income$0-10k$10-25k$25-50k$50-75kTotal
Not able to access the internet w/o ACP36.2%39.2%34.8%28.4%36.2%
Race & Ethnicity Distribution     
White47.9%59.2%57.5%48.9%54.5%
Hispanic18.8%14.1%17.5%15.3%16.3%
Black15.8%10.6%11.0%13.4%12.3%
Asian9.2%7.4%6.7%15.3%9.1%
Native American & Pacific Islander5.4%6.9%4.4%5.3%5.5%
Other2.9%1.9%3.0%1.9%2.4%
Age Distribution     
18-2931.0%15.9%20.5%22.5%21.5%
30-4426.4%21.2%33.6%45.0%31.0%
45-6034.3%40.5%32.9%25.6%33.9%
>608.3%22.5%13.0%6.9%13.6%

In Figure 3, we are looking at the activities that ACP households in general and in Figure 5, ACP households that would lose internet access but for ACP, are engaged in.

We show the data for both survey waves to highlight the consistency of the results over time. The two most used applications for their ACP connections are personal communications and banking, payments, investments and personal finance. In other words, ACP subscribers are using their subsidy to allow them to connect to the Internet and engage in the digital economy, whether it’s paying their bills or buying school supplies for their children.  Almost a quarter of ACP recipients use their internet connection for purchases, more than one in five (22%) need their internet connection for work, one in five (19%) for online education, and one in 8 (12%) to access government programs.

Figure 3: Behavior pattern of ACP-eligible Americans regardless of ACP participation

Figure 5 shows the impact of losing ACP. It also shows what applications really matter to people who critically depend on ACP for their broadband connection.  Banking and financial transactions, education and access to government programs are priorities for these citizens.

Almost half of ACP recipients would lose internet access altogether if ACP were to go away. 

This potential outcome presents a Catch-22: the government has pushed many programs online as a cheaper way to deliver services to low-income Americans.  Due to ACP,  22% of the targeted beneficiaries of this policy are receiving those services.  If ACP goes unfunded, 22% of the the very Americans Congress says it wants to help out of poverty will be stranded.

Seems like ACP is working but perhaps will be so effective, Congress will kill it, but at their peril.