Competition
The IAB just published its 2016 advertising revenue figures. It was a banner year with record setting revenues of $72.5 billion, 22% higher than last year. This makes digital advertising the number one advertising medium in the United States as TV advertising according to eMarketer came in at $71.3 billion. Seventy-five years after the first TV commercial and 25 years after television became the largest advertising medium, a new king of advertising has been crowned. We cannot underestimate the significance of this event. Advertisers demanding efficiency and effectiveness measurements have voted with their wallets to make digital advertising the biggest spend category. But even within digital advertising, we are seeing major shifts away from “traditional” desktop and fixed digital advertising towards mobile advertising. Growing from basically nothing ten years ago, mobile advertising is now a $36.6 billion segment and represents 51% of digital advertising
|
Ad Format in millions
|
2015 Revenue
|
2015 Share
|
2016 Revenue
|
2016 Share
|
Growth
|
Growth percentage
|
|
Search
|
$20,481
|
34.4%
|
$17,756
|
24.5%
|
($2,725)
|
(13.3%)
|
|
Classified & Directory
|
$2,757
|
4.6%
|
$2,345
|
3.2%
|
($412)
|
(14.9%)
|
|
Lead Generation
|
$1,756
|
2.9%
|
$1,989
|
2.7%
|
$233
|
13.2%
|
|
Mobile
|
$20,677
|
34.7%
|
$36,641
|
50.5%
|
$15,964
|
77.2%
|
|
Display
|
$13,881
|
23.3%
|
$13,790
|
$19%
|
($91)
|
(0.6%)
|
|
Total
|
$59,552
|
|
$72,521
|
|
$12,969
|
21.7%
|
Source: IAB 2017
What is hidden beneath the numbers is that mobile advertising is taking more than the entire growth of digital advertising. Advertising is clearly going where Americans are spending more and more of their time and where most of the data traffic is being consumed. Advertising is also moving into the segments dominated by Google and Facebook, which are dominating mobile advertising to a much greater extent than the fixed internet.
As we can see below, the combined share of Google and Facebook increased from 2015 to 2016 from 67.4% to 71.2% as the mobile strategy of both companies paid off. Google and Facebook, the two largest players, represented a combined 89% of the entire growth of the digital advertising market. The Herfindahl-Hirschman Index (HHI), a commonly used metric to measure market concentration, is well north of 3,000. Markets with an HHI of 2,500 or higher indicate high concentration. If the current trend continues, Facebook will have a higher market share by the end of 2017 for digital advertising than all remaining competitors, excluding Google, combined.
|
Ad Revenues in millions
|
2015
|
2015 Share
|
2016
|
2016 Share
|
Growth
|
Share of Growth
|
|
Google
|
$31,300
|
52.5%
|
$37,600
|
51.8%
|
$6,300
|
49%
|
|
Facebook
|
$8,900
|
14.9%
|
$14,100
|
19.4%
|
$5,100
|
40%
|
|
Everyone Else
|
$19,400
|
32.5%
|
$20,800
|
28.6%
|
$1,400
|
11%
|
|
|
$59,600
|
|
$72,500
|
|
$12,900
|
|
Source: Digital Content Next
Just as a comparison, another other big internet company, Netflix, had $5.1 billion is US sales in 2016 – the same amount by which Facebook grew in just one year – from 2015 to 2016. This demonstrates how significant advertising-driven digital businesses are in the TMT sector. Google and Facebook capture 89% of all growth in digital advertising, which impressively counters the Google narrative that “competition is only a click away.” While this might be true in theory; in reality when a company grows as fast as all other competitors combined, the narrative sounds hollow and self-serving. This is especially true when the only competitor that is half way keeping pace with Google – Facebook – does not rely on search engine recommendations for its traffic.
Even more concerning is the loss of diversity of sources of advertising revenues. In 2007, Google generated just over 60% of its advertising revenue from its own sites, showing a reasonably healthy advertising ecosystem when one considers that most of its advertising revenues came mostly from search. Ten years later, Google derives more than 80% of its advertising revenues from its own websites and services.
|
Global Revenue in Millions
|
2014
|
2015
|
2016
|
|
Google Properties
|
$45,085
|
$52,357
|
$63,785
|
|
Google Network Members
|
$14,539
|
$15,033
|
$15,598
|
|
Total
|
$59,624
|
$67,390
|
$79,383
|
|
Google Properties Percentage
|
75.6%
|
77.7%
|
80.4%
|
Source: Alphabet
The increasing percentage of Google’s revenue being derived by its own properties combined with very lackluster growth for non-Google properties raises questions of potential search engine bias or a precipitous decline in the ability of Google Network members to monetize their sites. Either way, it is not a healthy trend
As they have become increasingly successful and dominant, Google and Facebook have been able to increase their revenue per user. Google has increased ARPU by about a third, whereas Facebook has been extremely successful by more than doubling ARPU in the US and Canada within 24 months.
|
US/Canada ARPU
|
2014
|
2015
|
2016
|
|
Google
|
$9.59
|
$10.68
|
$12.76
|
|
Facebook
|
$9.00
|
$13.70
|
$19.28
|
Source: Facebook, Alphabet
Especially Facebook, which now considers all of its customers to be wireless users, has increased its ARPU into the range of a traditional prepaid wireless subscriber. We should consider these significant monetization advances by Facebook and Google combined with their wireless overlap. Verizon is planning to emulate this with its new Oath business unit – the combined AOL and Yahoo properties. Verizon will have the same reach as Google or Facebook with a programmatic advertising engine. The fundamentals are in place for Verizon to become a serious competitor to Google and Facebook. It all comes down to execution now.
The FCC is seeking to more closely regulate a key tactic in mobile carrier marketing—their performance and speed claims.
The commission already does this for fixed broadband and has proposed to use crowd data to set the upper limit for carrier marketing claims.
But here’s the problem: There are significant differences between crowd and scientific testing.
Crowd testing is easier to conduct but tough to draw out any useful conclusions, while scientific testing takes significant resources to conduct but provides easy-to-understand and useful results based on a methodical process that is accurate and enables apples-to-apples comparisons. As a result, the FCC, in taking a shortcut with crowd testing, will not present the full or fair picture of the performance and speed of mobile providers.
Although the differences between crowd and scientific testing could just be chalked up merely to competition, with both sides advocating their approach, a major government agency has decided to throw its lot in with a crowd tester. Such an approach will provide a limited view of the mobile consumer experience and won’t provide an accurate reading of the service providers’ strengths and weaknesses.
In this report, we provide an overview of both scientific and crowd testing and provide a number of observations on the right policy direction.
AT&T is launching an aggressive new offer providing unlimited voice, text and data to customers who have AT&T wireless and DirecTV service. The service is competitively priced at $100 for the first line, $40 for the second and third line, and free for the fourth line. Immediately available to 4.5 million AT&T wireless customers who also have DirecTV as well as new customers for a combined offer, the immediate and most logical target segment is the 21 million AT&T wireless customers who do not have DirecTV and the 15 million DirecTV customers who do not have AT&T wireless service, who are offered significant incentives to bundle. The unlimited data offer allows consumers to watch their DirecTV service or any other video service they have access to on the go as if they are at home in the video quality of their choice. The larger the screen they watch mobile video on, the more significant the noticeable visual difference.
AT&T is able to provide such an offer as it set itself up a lot more broadly than its competitors: nobody else has wireless, TV, fixed internet in 21 states, as well as home automation. It’s competitors are increasingly single or dual point solutions that cannot match AT&T’s full product portfolio. For AT&T, the current state is the result of deliberate strategic choice made by Randall Stephenson and his senior team to provide customers a comprehensive, integrated solution from one provider rather than to ask them to create a solution based on individual services from different providers that the consumer has to integrate themselves. AT&T as an operator is following the same basic strategy as Apple and Microsoft who believe that an integrated user experience designed with the same vision will create a better user experience and has a better chance of creating product and service combinations that are more useful and satisfying than one-off stand-alone product and services. The difference is AT&T is approaching it from the network and connectivity starting point, whereas Apple and Microsoft begin from the OS and device point. The clearer the vision, the further the reach, the better integrated, the greater is the impact on customer’s lives. As the strategy is taking shape in the form of integrated offers, the results depend on execution, satisfying the latent demand by customers who have an increasingly mobile lifestyle.
It will be interesting to see how competitors will respond to this offer. Competition has driven the competitors into uneven product match-ups as management decisions and circumstances created differentiated competitors who have limited ways to respond to such an offer.
When AT&T closed the DirecTV deal, Sprint offered DirecTV customers a year of free Sprint service. Who knows what Sprint will offer this time? One year? Two years?
The cable companies have a similar content line up they lack the partner to provide a similar offer as they partnered with Verizon Wireless with the option to launch an MVNO. While Comcast has activated their MVNO option three years after they close their deal with Verizon Wireless, it might take a while longer for Comcast to launch it. T-Mobile, based on the Binge On offer would be a more fitting partner for cable, would be ecstatic if the cable providers would come hat in hand looking for a closer partnership. Can you imagine the tweet storm coming from John Legere?
Verizon could probably match AT&T in its FiOS footprint in the Northeast, but that in itself would make the situation Verizon is in more apparent than it is already – being an increasingly pure play wireless service provider with a limited TV footprint. Its answer to the increasingly converging telecom and media world, Go90, is considerably narrower in terms of content and more focused on just one demographic segment than AT&T’s video offer, which also limits the upside.
The closest in terms of unlimited is T-Mobile with its BingeOn offer. While it is a “bring your own video” offer and keeps video quality at DVD levels, its strength and weakness come with the power and restrictions of the associated video service and the associated screen. While it is understandable from an economic and network loading perspective, BingeOn is a tradeoff. The larger the screen and the greater the resolution of video stream, the more visible the quality restriction becomes for consumers, but ultimately consumers should be able to make the choice what is right for them.
AT&T is able to offer an unlimited data plan again as is bringing more spectrum online most noticeably in the WCS band, the expectation of more spectrum becoming available through the auction process, the re-farming of 2G spectrum that is significantly less spectrally efficient than 4G LTE, as well as redesigned its data network to be a video first network. The focus on DirecTV/AT&T wireless customers as well as this being a limited time offer will lessen the impact on the network. When the load on the network becomes too large, AT&T can simply conclude the open-ended promotion.
Earlier this week the International Telecommunication Union (ITU) reported the results of its annual global survey. Mobile broadband connections (47.2% of the global population) have now overtaken households with internet access (46.2%) not to mention fixed broadband connections (10.2%) In terms of the ITU’s Internet Development Index, the US remains among the 15 most developed countries. While some alarmist consider that a poor showing, they do not take into account the differences in size, both population and geography, as countries such as Hong Kong (31 square miles and is part of China) as well as Iceland (200,000 inhabitants) and Luxemburg (543,000 and smaller than Rhode Island) are ahead of the US. The US improved in the rankings again this year. Can the US do better with an investment-friendly policy frame work? Yes, it can.
Later in the week, the Center of Disease Control (CDC) just released an update to their recurring wireless substitution report documenting the shift away from landlines to mobiles. Now you may ask why the CDC does a wireless study: The answer is easy. As part of its National Health Survey, it added a question if respondents have wireless phones, landline phones or both and combined with all the other demographic information it collects, the survey has become the definitive source for tracking cord-cutting trends.
For the first six months of 2015, 47.4% of the respondents said they had a wireless phone but no landline anymore, i.e.; people we consider cord cutters. For families with children, this number has risen to 55.3%. Initially, cord cutting was accelerated due to the 2005 introduction of a wireless option to the Lifeline program, but in recent years the general population has caught up. While in 2012, only 30.7% of the non-poor Americans had cut the cord, this has increased to 45.7% in 2015, whereas for poor Americans the cord cutters only increased from 51.8% to 59.3%. Employed Americans have increased their cord cutting from 38.4% to 52.7%, whereas unemployed American cord cutting is a lot lower, increasing from 23.6% to 32.7% in the same time frame.
The biggest difference in the adoption of cord cutting depends on where Americans live and their age. Americans in the Northeast are substantially less likely to have cut the cord (31.6%) than Americans in other parts (47.1% to 51.9%.) This does not mean that Northeasterners are immune to cord cutting as the number of cord cutters increased by 50% in the last three years, but is more due to their historically slower start. Not surprisingly, Americans over 65 have the lowest adoption of cord cutting, but never the less almost doubled the cord cutting over the last three years from 10.5% to 19.3%. Never the less, this is still substantially less than the next lowest cord cutting adoption age segment of 45-65 with an increase of 25.8% to 40.8% over the last three years.
As wireless substitution becomes the norm, in-building wireless usage becomes critical as the mobile phone is increasingly becoming the only communications device Americans rely on. The onus lies on local planning boards to do their part to enable wireless network infrastructure to be built quickly. The FCC has introduced a 60-day and 150-day shot clock for collocated or small sites and new cell sites respectively. Local municipalities must now react more quickly on requests for permission to build new cell locations so that Americans can reliably use their mobile phones while at home, just as they do while en route, whether it’s to check their sports scores on a Sunday afternoon, calling or texting their friends, or to call 911 in a case of emergency.
Five years after the FCC called for data on the state of the special access marketplace from just a portion of the providers offering special access, the agency appears poised to modify contracts and embark on a new round of rate regulation based on market data from 2010 to 2012. This would not be a concern if in fact the market for special access services had stagnated in 2012 with prices and providers remaining constant; however, that is not the case. Why should we care if the FCC premises a new set of pricing regulations on outdated information? Let me explain.
Special access refers to the dedicated data connections that physically connect a business, an office park, a government building, a cell site, or other man-made structure to the larger public switched telephone network and the Internet. The number and kinds of companies offering special success services has increased substantially in the last few years. When Sprint issued RFPs for backhaul related to its Network Vision program, more than 20 providers responded. The pricing was so competitive – so low – that even at the most hard-to-reach sites where competitive pressure should be the smallest, at least one potential bidder decided not to submit a bid because they were unable to provide the service profitably.
There is much debate about the reality of the market for special access and market data is hard to get, but not impossible. Zayo is the largest stand-alone backhaul and special access providers in the country (it’s one of T-Mobile’s backhaul providers), and provides very timely pricing trend data. In its Q4 2015 Pricing Trends document, which Zayo publishes with its earnings release, we can follow the prices Zayo is charging in the market place. Traditional DS1 revenues have declined from $1,147 per DS1 (also known as T1) to $783 per DS1. For DS3s (also known as T3) revenues have declined in the same time period from $4,081 to $3,269. Just to put this in context, a DS3 has 28-times the throughput of a DS1, for roughly four times the cost.
As part of the wireless industry’s drive to stay ahead of consumers’ appetite for high-capacity data services, building more backhaul has been essential. As Sprint has embarked on its Network Vision program, it has also revamped its backhaul provisioning. Gone are the days when Sprint was predominantly reliant on its direct competitors to provide backhaul; it now has a stable of thirty to forty alternative access providers, in addition to its own wireless backhaul in the 2.5 GHz range. T-Mobile has also been no slouch; almost all of its backhaul is now Ethernet fiber, which is part of the reason why its download speeds are so fast. The cost savings for both companies are substantial. In its Q4 2014 financial results, T-Mobile USA’s quarter over quarter cost of service was down 7.1% partially due to renegotiated backhaul contracts.
In addition to having a multiplicity of providers from which to obtain their special access lines, wireless companies continue to experiment with other solutions that can improve network performance and reduce cost. For example, companies are experimenting with self-backhaul where access and backhaul are part of the same system. This solution is intriguing but not currently viable in today’s spectrum environment due to the amount of spectrum needed to make it a reality. In the spectrum-constrained environment that characterizes the mobile market in the U.S., T-Mobile, AT&T and Verizon Wireless are all in the same boat. Because wireless self-backhaul could provide more options for carriers, this should be an additional reason for the government to redouble its spectrum clearing goals and aim for at least one gigahertz of spectrum for the wireless industry below 6 GHz.
It’s important to note that DS1 and DS3 lines are legacy products that are at the end of their technological life. As the industry has moved on to Ethernet connections, the number of DS3s sold by Zayo has declined from 3,569 in September 2013 to 2,772 in June 2015, a 23% drop in less than two years. For DS1s, that decline has been even more pronounced – from 3,569 to 2,772, a 38% decline from September 2013 to June 2015. It is perfectly understandable that the lack of new demand for DS1s and DS3s makes some providers hesitant about issuing new long-term contracts, as it would obligate them for many years to divert time and money to support a dying market. If we take Zayo’s data and project out the current decline rate then they will have stopped selling DS1s in three and a half years and DS3s in less than seven years. But these projections are deceiving, and likely too conservative, as declines are accelerating as the DS1/DS3 technology becomes increasingly obsolete.
Zayo’s data shows a massive shift to Ethernet connections, which are both faster and cheaper than DS1/DS3, and where the marketplace is essentially even as new entrants and incumbents are building capacity at the same time. Zayo’s data shows a steady increase in demand, as well as falling prices per unit. The way Zayo represents the data – grouped in 10 to 100 MB, 101 to 1000 MB, and above 1GB – shows that customers are buying larger and larger pipes for lower prices per unit, which is consistent with the commonly observed conditions in the marketplace. The market is so competitive that further industry consolidation among backhaul providers seems inevitable because so many competitors are barely, if at all, breaking even today.
Into this competitive dynamic steps the FCC which seems to want to set prices. But nobody, including the FCC, knows how low special access prices can continue to fall with means the agency runs the real risk of setting rates at an artificially high level. In international markets where regulators set termination rates, everyone charges the government-set rate regardless of the actual cost, especially when the cost is lower than the government mandated rate. In the United States, where operators can freely negotiate call termination rates, per minute prices are $0.0007. In countries where the regulator sets the rate, the rate is higher than in the U.S. and Canada , as a 2012 OECD report shows. In the lowest-cost government controlled market, France, the termination rate was almost 20 times higher than in the U.S., with $0.0139, going up to $0.0878 in markets like Estonia, where the government-set rate is 125 times the rate U.S. operators negotiated with each other. Canadian operators that can also set prices freely went even further than their U.S. peers and eliminated termination rates entirely.
If the FCC were to set a price level –even if it is meant to be a price ceiling – the market would take it as a benchmark for what it should charge for special access charges. The shake out would continue with the weaker competitors selling to the lower-cost providers, but at a lower competitive intensity level and higher prices than if the FCC would have not intervened. The winners would be the special access providers that are able to offer service above the cost of the most competitive players, but below the government-set rate. It’s a classic rent-seeking scenario where marginal players ask for government intervention to safeguard their survival and increase their profits at the expense of end customers. The losers would be the end customers: businesses that have to pay the government-mandated rate when competition would have driven down prices below what the FCC deemed appropriate.
The impact of FCC intervention would be analogous to rent control in the housing market, which Economics Nobel Prize winner Gunnar Myrdal called “the worst example of poor planning by governments lacking courage and vision.”
They say a picture is worth a thousand words. If that’s the case, then the Twitter header image for Microsoft CEO Satya Nadella demonstrates that perfectly. Just look at Nadella’s tortured smile then try to make sense of the picture in the header. It resembles some kind of hellish, hopelessly complex landscape that maybe someone at Microsoft understands and loves. But, for a company that wants to solve problems, it’s the wrong way to start. Nonetheless, it does provide the perfect illustration of what is and isn’t happening at Microsoft.
The decimation of its handset business is just the latest symptom of the fundamental lack of clarity when it comes to Microsoft’s role in the world. For a company that says it’s “mobile first” the 7,800 layoffs are a striking admission of the utter failure of its mobile strategy. This moves essentially shuts the door on all but a few remaining Microsoft employees in Finland.
It is a classical “the emperor has no clothes” moment.
Nokia’s fate was sealed when mobile devices started doing more than “connect people.” With its life on the line, the organization could not find a new reason to exist in the significantly changed—and still changing—world. Microsoft’s fate will be similarly sealed if it cannot provide a clear vision and an elegant implementation of its vision of how consumers will use technology—from “mobile first” over nomadic laptops and stationary desktops.
As the consumer reemerges as the focal point of technological innovation, Microsoft seems to be hopelessly stuck in an antiquated, we-do-it-this-way-so-like-it-or-lump-it, corporate-centric approach.
During briefings, when I asked Microsoft how it plans to differentiate its products and services from Apple’s and those of the Android ecosphere, company representatives consistently replied unflinchingly with, “We make consumers more productive.” I was taken aback. “No, seriously, how will you differentiate?” I followed up. The reply? “Seriously, we’ll lead with making the consumer more productive.” I remain flabbergasted by the wide disconnect between how consumers think, what they want, and what Microsoft plans to force for them—especially from a company that surveys the living daylight out of consumers. How many consumers have ever woken up in the morning and declared they want to be 2.3% more productive today through the use of Microsoft products and services. You might sell a CIO on that, but definitely not a consumer. The lack of vision and understanding of what “mobile first” actually means beyond the tag line that an 8-year old could recite at a school play will turn off CIOs even more so.
Looking at it in hindsight, the handset group never had a chance as a full portfolio device manufacturer. The lack of a clear and concise vision at Nokia was replaced with an empty shell around the “mobile first” term. Mobile devices produced by the handset group have been very good devices—competitive with or even superior to devices that have significantly outsold them.
The lack of success for Microsoft in mobile is not because the division didn’t know how to make excellent devices. Rather, it comes from the lack of a compelling, holistic value proposition. Why would someone buy into the Microsoft ecosphere when they have so many choices? The company’s lack of a value proposition is glaringly apparent in the most competitive and newest segment (which, of course, cares the least about incumbency power): Mobile. The retrenchment into a core device team that creates fewer phones, but is hampered by a lack of corporate focus, will merely reduce the mobile price tag of a poorly defined overall corporate strategy.
Microsoft needs to realize that this “mobile first” world requires that its pace of innovation and attention to detail accelerate to mobile speeds company-wide.
That means it must produce new releases annually. Poor product releases like Windows 8—the equivalent of panicky software jambalaya, packed with reactionary knee-jerk features and devoid of attention to detail—cause a staggering amount of damage.
It would be okay for Microsoft to have a conceptual and executional meltdown once a decade. But Microsoft manages to do this with every other release of Microsoft Windows. Windows 10 looks like a good release. But let’s have a look back: Windows 8 was just plain bad, Windows 7 was good, Vista was abominable, Windows XP was good, and consumers responded to Windows ME with a resounding “not me!”
History repeats itself if you look further back. To add insult to injury, the average upgrade cycle is 30 months, which means that unless you are forced to use a bad OS because it’s the only one that comes with your new computer, or if you just can’t take it anymore and switch, you have to wait 5 years for an innovative step forward. Why not just save a lot of money and aggravation and just skip over other release and pour the resources into the successful update? No wonder Apple has taken so much market share from Microsoft with this two steps forward one step back product release cycle. The only saving grace for Microsoft is its huge imbedded base and the lack of a serious competitor in the business market.
But if the only reason why people purchase your product is that they have always purchased it and there is no viable alternative, one shouldn’t be surprised if there a competitor emerges. An initial stream businesses are already migrating toward Apple and if Apple shows some love and care, the stream will turn into a raging torrent. As Apple is on its path to integrate the user experience across hardware platforms, its success in mobile is expanding its beachhead in laptops and desktops, where it is continuously increasing market share, despite offering only computers $899 and above.
The most pertinent lesson is close to home: It took only a few years for Nokia to go from 50% global market share to 2%. Now Microsoft’s handset group faces the unenviable task of explaining to other handset manufacturers why they should build more Windows Phone devices, even as Microsoft pulls back in spectacular fashion.
Microsoft will fail if it continues to be a confused conglomeration of businesses units with terrible track records getting their products to work together. It would be a good start if all of their products and services would come together and work seamlessly across hardware platforms. That very fact would make the lives of their custome
In 2014, roughly 143 million mobile phones were sold in the United States, approximately 90% of them smartphones. This is a decline of 25 million phones from 2013 when approximately 168 million phones were sold – and only half of them were smartphones. The decline in phone sales is predominately due to the rise of equipment financing plans, compounded by slower new subscriber additions. At the same time, consumers’ phone purchase habits have changed significantly. A growing number of American consumers delay their phone upgrades to take advantage of the lower monthly service prices carriers offer to consumers who wait to upgrade phones at the end of their two-year contracts.
Consumers who are purchasing replacement phones are focusing on newer, higher priced devices. Even though device sales declined by 15% year-over-year, device revenues increased by about 5%. In the short term, this flight to higher priced devices increases revenues and profitability for mobile carriers, but longer-term the trend is negative, as it takes longer for new devices to permeate the network. Device manufactures are cheering the higher revenues as the market has shifted heavily towards higher priced smartphones. Now that smartphones make up 90% of handsets sold, device manufactures can no longer cannibalize feature phones for significant revenue upside. We expect device sales to fall by 5% to 136 million in 2015 and to fall again by 4% to 131 million in 2016.
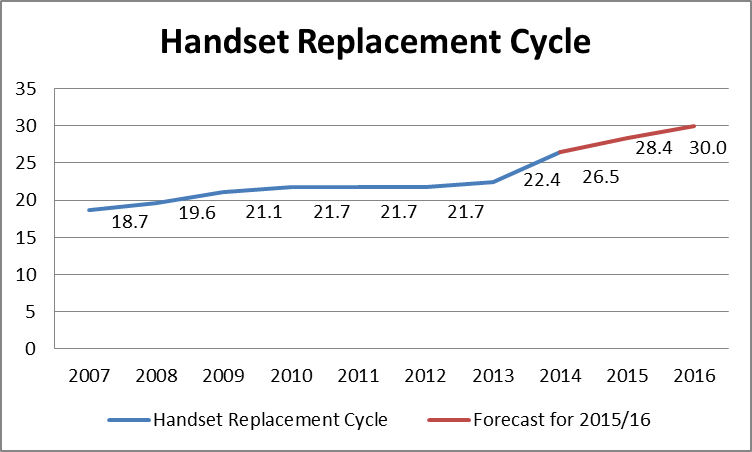
With device sales and new subscriber additions declining, the impact on the handset replacement cycle has been significant. Handset replacement has abruptly slowed to the lowest rate since we began calculating the metric. The introduction of Equipment Installment Plans (EIP) has made a significant impact on the handset replacement cycle by extending it to 26.5 months in 2014, an increase of 4.1 months compared to the previous year.

Americans typically upgraded their phone at three points in time: Roughly every year when a new generation device was launched; approximately every two years when the contract expired, causing customers to either change operators or became eligible for subsidized prices; or whenever their phones became obsolescent or stopped working. With the rise of EIP plans that incentivize both rapid upgrades every year and delayed phone upgrades through discounted service pricing, consumers have eschewed the traditional two-year service plan upgrade cycle.

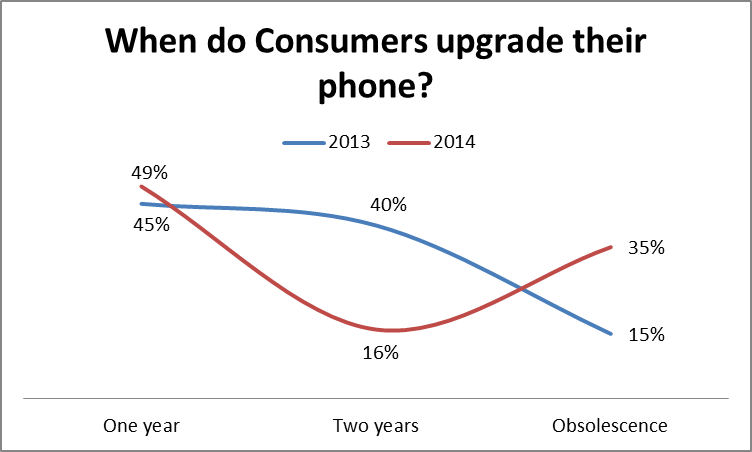
The percentage of devices being replaced every year increased from 45% in 2013 to 49% in 2014, while the percentage of devices that replaced obsolete devices sky rocketed from 15% in 2013 to 35% in 2014. The percentage of devices being replaced at the traditional two year time point fell from 40% in 2013 to 16% in 2014, while they represented slightly more than 50% of replaced devices from 2010 to 2012. As As Americans bifurcate their purchasing behavior, we are observing the beginning of a capabilities gap between Americans who upgrade their phone every year and those who upgrade it when the device becomes obsolete or breaks.
The handset replacement cycle measures how often existing customers are upgrading their phones. It is an important measure of how close the average consumer’s device is to the technical state–of-the-art. Whereas most consumers used to upgrade after two years, today’s market sees an interesting dichotomy: Nearly half of consumers upgrade every year, but more than a third keep their devices until they become obsolete. A longer handset replacement cycle will have several ramifications on innovation throughout the mobile ecosystem:
- Less innovation in applications: Application capabilities may be artificially restrained, as developers deal with an average consumer who is less able to take advantage of new technologies that improve the utility of the device and service. The introduction of EIP has created an earthquake-like, tectonic shift in when Americans are upgrading their mobile phones. Software developers face a new dilemma, as they must nowgrapple with the fact that a large percentage of smartphones in use won’t be able to run their new cutting edge apps. In order to run on the largest number of devices possible, some developers won’t build the latest-and-greatest capabilities into their apps, thereby slowing the pace of innovation in the mobile space.
- Less competition from smaller handset providers. Most handset manufacturers – who are already struggling to remain profitable – will be under pressure to cut their research budgets as revenues decline, therefore reducing the amount of effort dedicated to making the next generation smartphones even better. Smaller handset providers are going to be disproportionally hit, making their devices less competitive compared to larger handset providers — leading to a shakeout.
- Spectrum crunch in major markets. The spectrum crunch in major markets will be worse than otherwise as older devices cannot access new spectrum bands as they are lacking the necessary electronics for it. Device capabilities determine which network capabilities the phone can access. A six year old iPhone 3G will achieve download speeds of 2 Mbps with its first generation WCDMA chipsets, whereas a new iPhone 6 will be able to download the same content 25 times faster due to its new 4G LTE capabilities able to access newly licensed spectrum. As fewer people upgrade their devices, the pace with which consumers can use new unused parts of the networks on new spectrum slows down and consumers are stuck on congested legacy spectrum. This engineering reality is particularly important as mobile operators are currently spending more than $45 billion on new spectrum.
- Delayed transition to next-generation services. The monumental transition to VoLTE — and therefore to a more efficient use of spectrum, with significantly better voice quality — will be slowed by an embedded base of older devices.
To be sure, despite the bifurcated market and all the problems caused by it, some positive developments could still increase revenue for manufacturers:
- Speed boosts. Faster speeds mean access to better and more content and higher profits for web retailers and carriers alike. The faster the download speeds a device can support, the better the user experience as the consumer does not have to wait for video content to be buffered or web sites to be loaded. According to Akamai, a one second delay in page load results in a 7% decline of purchase conversion.
- More power. Access to more advanced screens and processors allow more appealing graphics and more powerful applications to run on your phone. This begets more usage and more consumption of content which in turn generates more revenue and profits for multiple entities across the mobile broadband value chain.
- Better batteries. Newer battery technology allows phones to run longer allowing them to be used to do more for a longer period of time. This too impacts the virtuous cycle of more use begets more revenues and profits.
Unfortunately, those longer-term developments could be largely offset in the short term by the slowed innovation and cramped spectrum caused by delayed handset replacement.
Who are short-term and long-term winners and losers in this change?
- US Consumers: Short-term winner, long-term loser.
Consumers get $20 per month more in their pocket for waiting to upgrade their phone. In the longer term, consumers will have fewer choices and delayed mobile phone innovations and fewer new apps taking advantage of new hardware features than they would have in a higher volume scenario with more device manufacturers. - The US (app) economy: Short-term winner, long-term loser.
While an approximately $12 billion per year (50 million devices times $20 per month) in additional stimulus for other the rest of the economy is helping boost restaurant sales and reducing consumer debt, the economy will feel the long-term negative impact. As consumers and businesses alike are tempted to delay an upgrade, the beneficial impact between mobile and productivity in the US will weaken as new services that save us money, improve our lives, and make the economy more efficient take longer to be implemented. One especially poignant example is mobile payments. ApplePay is revolutionizing mobile payment with high attachment rates because people with the new iPhone 6 can take advantage of ApplePay. People who delay cannot, creating a barrier to adoption. The same is true for NFC (or not) enabled devices for other mobile payment platforms like PayPal or Google wallet. - Device manufacturers: Short-term winner, long-term loser.
Device manufacturers benefitted handsomely as smartphones as a proportion of handset sales increased from roughly 50% in 2013 to 90% in 2014 and profits surged. In 2015 and onwards, profits will fall as the number of devices will continue to decline - T-Mobile: Short-term big winner, long-term loser.
T-Mobile successfully reshaped the mobile industry through the introduction of its EIP, and has grown faster than all other carriers combined. At the same time, roughly 30% of its new customers did not buy a new handset, but brought their own. As a result, the handset base is aging and cannot take advantage of new bands like 700 MHz and VoLTE. The introduction of SCORE! has to be seen in the context that T-Mobile wants to speed up the handset replacement cycle, and is willing to incur a modest subsidy. - AT&T: Short-term winner, long-term loser.
AT&T followed T-Mobile aggressively into the brave new EIP world. AT&T has been able to defend its base against lower priced T-Mobile and other operators who offer EIP financial benefits as device subsidy expenditures have declined significantly. AT&T will face the same problems as T-Mobile as the device universe of its customers ages. - Verizon: Short-term neutral, long-term neutral.
Verizon is holding on as tightly as it can to the status quo, while offering customers who want it an option to do EIP. In the short term, Verizon benefits less than T-Mobile and AT&T from the changes, but will also not suffer as much from a lengthened handset replacement cycle. - Sprint: Short-term loser, long-term winner.
Sprint, like every other company, dabbles in EIP offers, but only Sprint with its 24-month handset leasing program has a viable plan in place to keep the device upgrade cycle in place and reap the benefits from a customer base with newer devices.
Over the last two years, in addition to attracting new customers, most of the wireless industry has focused on better serving its existing consumers with products and services those consumers want. We all watch more mobile video and play mobile games. As a result, an unsung hero—in form of the tablet—has emerged. Launched only 4 years ago by Apple, the iPad was quickly imitated by others. Initially, the main focus was on Wi-Fi-only tablets, which are only connected close to a hotspot. But now, as Wi-Fi-only tablet sales slow, LTE-connected tablets have gained in popularity and have become a significant growth source for carriers as the traditional mobile phone business weakened and shifted considerably.
Exhibit 1: Postpaid branded net additions by device category, Q4 2013 to Q3 2014

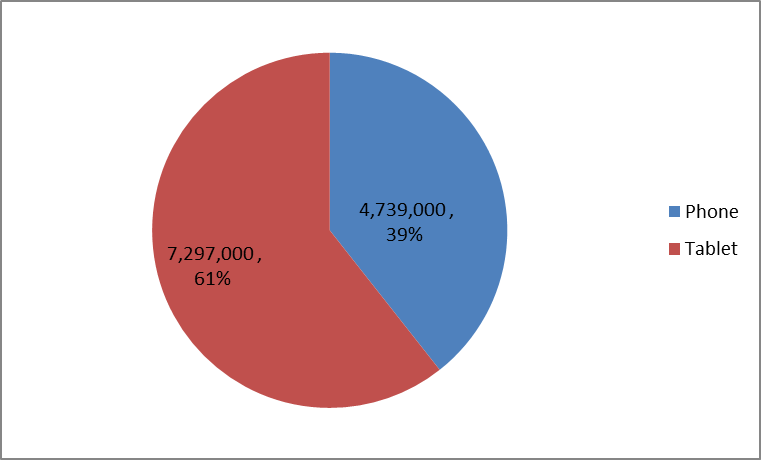
This trend culminated over the last four quarters, with 61% of the branded postpaid growth of the four nationwide operators coming from tablets. This development shows the tremendous change that the mobile industry is continuing to undergo and identifies a significant driver of the growth in data consumption by the most suitable device—tablets—for media consumption and gaming.
Why have consumers, who in years past mostly ignored tablets with wide-area connectivity, suddenly shifted their purchasing behavior? Three factors led to this significant change:
1) The cost of service has declined: The introduction of mobile share plans has made tablets economically possible for consumers. Before mobile share plans, adding a tablet meant a separate data plan with a separate data allotment for $40 or more—in addition to paying $100 or more for the tablet with wide-area connectivity compared to a Wi-Fi only device. With mobile share plans, adding a tablet is typically only $10 per month, still within the realm of impulse buying or cheap enough justify it as a way to pacify a child in the back seat of the car or a husband needing to watch NFL Sunday games just about anywhere.
2) The cost of tablets has declined: A substantial decrease in the cost of wide-area connected tablets from various manufacturers has made them more affordable. While wide-area Android tablets were as much as $500 when they were first introduced as a lower-cost alternative to Apple iPads, the unsubsidized retail cost has come down to roughly $250 without a contract or commitment. If a consumer enters a 2-year contract the cost of the device is $100, but even that is frequently discounted down to zero.
3) Equipment installment plans have made devices even more affordable: A $250 tablet is generally about $12.50 per month on an installment plan offered by the nationwide operators. As many Americans generally prefer to pay over time instead of upfront, the addressable market for tablets increased substantially.
Not every operator is, or has been, equally dependent on tablets for their growth. Tablet promotions have become the operator’s weapon of choice to make their quarterly postpaid branded subscriber growth number. When we look at how dependent operators are on tablets for growth, quite an interesting picture emerges.
For Sprint, a Beacon of Hope
Even as Sprint went through a sea of troubles attracting new subscribers to their network, its success in tablets served as a beacon of hope for the company. The company jumped aggressively on the tablet trend and succeeded in satisfying customer demand.
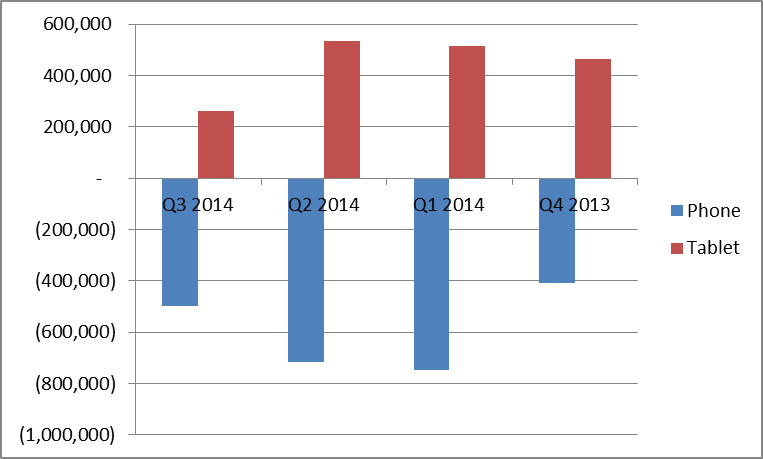
Exhibit 2: Sprint postpaid branded net additions by device category, Q4 2013 to Q3 2014

While Sprint lost almost 2.4 million branded phone connections in the last four quarters, it gained almost 1.8 million new tablet connections. Losing 600,000 postpaid branded connections is nothing to write home about, but without its tablet sales, results would have been even more devastating.
AT&T, the Balancing Pioneer
AT&T was at the forefront of meeting customer demand for tablets. Because it was ahead of the market and other carriers in satisfying consumer craving for entertainment on the go, it initially struggled with the profitability of selling subsidized tablets. After developing the market and volumes, the overall market moved in AT&T’s direction. As a result, other operators shared the efficiency gains that come from higher sales volumes.
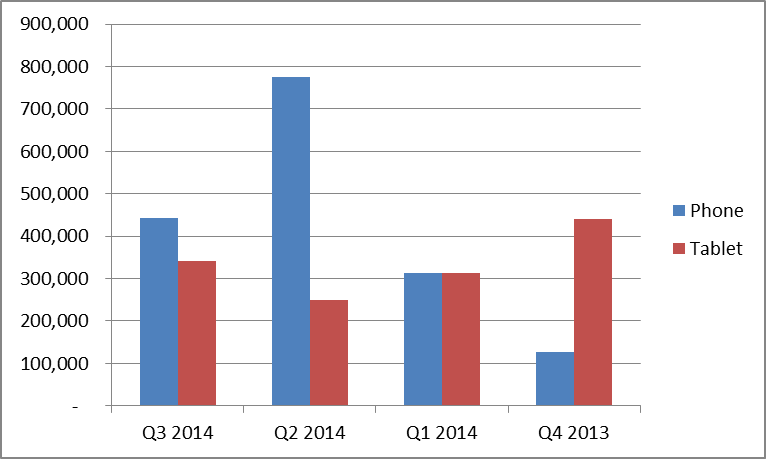
Exhibit 3: AT&T postpaid branded net additions by device category, Q4 2013 to Q3 2014

AT&T achieved the second most branded postpaid phone additions in the industry by capturing 1.65 million new phone customers, slightly ahead of Verizon Wireless but less than half of T-Mobile. It also added 1.45 million tablets, which represent 45% of its net additions for the last four quarters, giving AT&T the most balanced growth of the nationwide carriers. Slightly behind AT&T in recognizing the trend towards tablets, Verizon Wireless’ results show that more focus often leads to better results.
Verizon Adds Almost as Many Tablets as the Other Carriers Combined
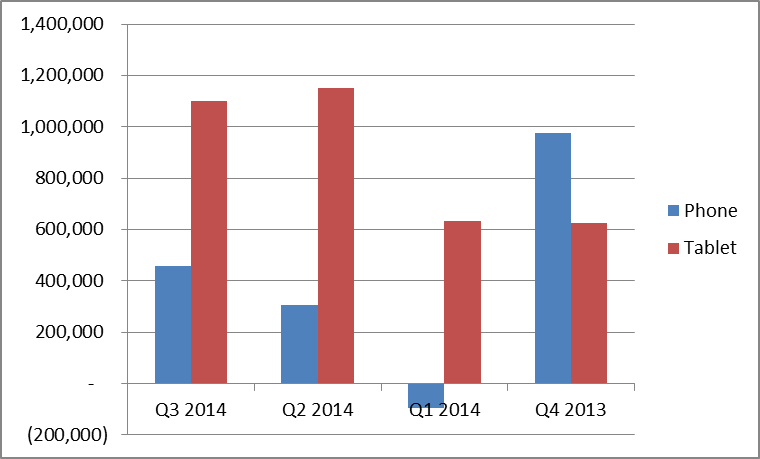
With a slightly larger customer base and slightly less new phone customers (1.64 million), Verizon Wireless added twice as many new tablet connections as AT&T with 3.5 million, compared to AT&T’s 1.3 million.
Exhibit 4: Verizon postpaid branded net additions by device category, Q4 2013 to Q3 2014

With more than two thirds of its postpaid branded net additions coming from tablets, Verizon Wireless had the highest net postpaid branded subscriber net additions. Since the majority of the growth was meeting the needs of current customers rather than new customers, it significantly overestimates the strength of the customer acquisition engine of Verizon Wireless. While Verizon Wireless can be satisfied that it added more connections than anyone else, being number three in branded postpaid additions in its core segment must be a wakeup call in Basking Ridge.
T-Mobile’s Lack of Tablet Focus Hides Future Growth Potential
T-Mobile’s relentless drive to innovate—sometimes more substantive than at other times, combined with a CEO that has almost become a Jesus-like figure to some—has yielded spectacular new branded postpaid customer growth. T-Mobile added more than 3.8 million new phone customers, growing faster than the rest of the industry in new phone customers combined. The operator was near death before John Legere arrived. He changed the rules of the game in wireless, revitalized the organization and took it to previously unknown heights.
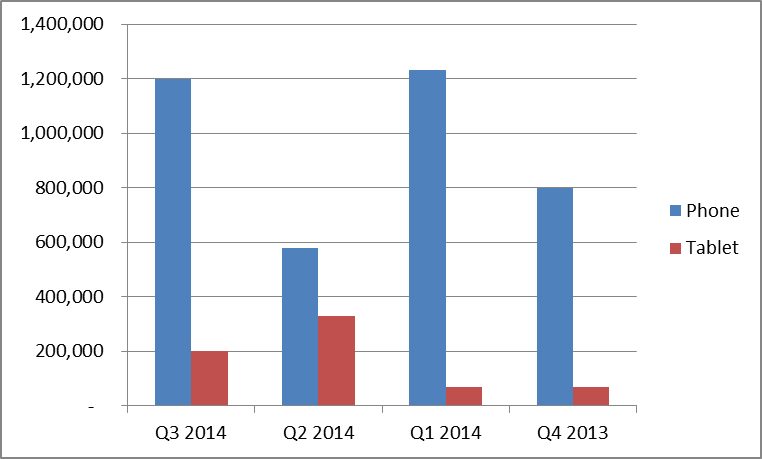
Exhibit 5: T-Mobile postpaid branded net additions by device category, Q4 2013 to Q3 2014

The only weakness in T-Mobile’s performance was its lackluster additions of tablets. Despite being the only operator that offers free data for life for tablets, T-Mobile added only a small fraction of tablets compared to its competitors. The company, which focused on new customer phone growth, largely ignored tablets as it added only 665,000 new postpaid branded tablets, a third of what Sprint achieved with roughly the same subscriber figures. But this apparent weakness in tablet sales now also gives T-Mobile the opportunity to go back to its current customers like its competitors and, with sufficient focus, add one to three million more tablets in future quarters.
All the while when we were trapped in the Title II News Blizzard that made any other topic seem small and irrelevant, the FCC has been conducting an auction of wireless spectrum. This wasn’t supposed to be the big auction – that honor was reserved for the incentive auction, in which broadcasters would sell spectrum they hadn’t deployed since the digital TV transition consolidated things. This was just an auction for “AWS-3” spectrum, Advanced Wireless Service frequencies in a high band that wasn’t expected to pique much carrier interest. The FCC had set a reserve price of $10.6 billion.
The auction has netted more than $43 billion and counting. Or, as the House Energy and Commerce leadership put it, “BOOM!”
The success of the AWS-3 auction has amazed the press and pundits alike. In fact, FCC Chairman Tom Wheeler has observed that “The AWS-3 auction is at these incredible levels … despite the fact that I’ve been talking about Title II all along.” While I don’t want to debate the FCC Chairman, it would seem a stretch to claim that the huge dollars being bid for AWS-3 spectrum are because the carriers embrace a particular regulatory framework. To the contrary, it appears the cold, hard reality of needing a key input for the business is driving the eye-popping bids. The auction seems to be exceeding everyone’s expectations in spite of the threats of extending Title II to wireless data (Title II currently applies to wireless voice, not data as some have alleged). The holiday season is a time of hope and clearly, the companies bidding in this AWS-3 auction are hoping that government regulation of wireless won’t render their investment null and void.
From a business perspective, the top reasons AWS-3 is blowing away its progeny are:
- The AWS-3 band is used everywhere on earth. It’s the only band out of more than 50 that can make that claim. If you’re a carrier with customers that travel the world, and you want your customers to enjoy 4G LTE, this is the band to have. Without AWS-3 spectrum, carriers have to resort to guesswork to determine which three or four bands will be sufficient for their customers to have global coverage.
- According to Mike Rollins at Citi Research, the 10×10 MHz J-block is trading at a 15% valuation premium compared to the average of the 5×5 MHz blocks. The valuation validates the engineers, industry analysts like me and international auction designers who have been saying that wider channelization and mid to high band spectrum combines to create the new beachfront spectrum. One can only hope that Auction 97 puts to rest the erroneous notion that lower band spectrum is somehow more valuable than higher band spectrum. The Mhz/pop values in Auction 97 are significantly higher than that in Auction 66, even adjusted for inflation. In a world where we have 99% 4G LTE coverage, the propagation advantages of lower band spectrum are being nullified by the need for smaller cells to provide more capacity. In an urban area, a 700 MHz network looks no different than 2500 MHz network – and a lot more people live in urban areas than in rural areas.
- Operators are scared by the delay in the ultra-complicated, one-shot-only incentive auction. That delay is a decidedly mixed blessing, because when reading the tea leaves, it quickly becomes apparent that at this point in the process, there aren’t enough broadcasters willing to part with their licenses to make this auction a success. The NAB’s lawsuit delays the auction and gives FCC the opportunity to make the auction more attractive and provides more time to convince more broadcasters that it is actually in their best interest to put up their licenses for auction.
- Historically low interest rates make the assumption of debt a viable means to pay for spectrum acquisitions. Just like home buyers can afford to spend more money on their new home due to lower mortgage rates, operators can afford to spend more on spectrum when they can borrow money to do so and do it cheaply.
- Spectrum is a finite, essential resource that drives the business. This means that as long as there is an ongoing and increasing in demand for it, spectrum increases in value over time.
- Auction 97 is here, it’s happening, and the frequencies are for real. The prospect of more spectrum in the foreseeable future is rather slim. The promised 500 MHz of spectrum for wireless is increasingly looking like a mirage in the desert. Contrary to what some people think, the bidding in Auction 97 seems to reflect the evaporated trust in the ability of the government to provide access to more spectrum in the future. They’re reflective of a flight into quality spectrum assets today, not a sign of trust in what the future will bring.
What is most exciting about the auction is yet to come – the build-out of the spectrum and expansion of existing networks. That will be the truly best outcome for American consumers and validation of the fact that spectrum auctions are the most efficient tool for allocating a scarce resource.
After several failed attempts to come up with a net neutrality proposal that reasonably addresses legal, industry and consumer advocate concerns around the optimal legal foundation for net neutrality, the FCC made public last week it wanted to pursue a new “hyrbrid” approach that would apply both Title II and Section 706 regulations on Internet providers. While the policy elite inside the Beltway pondered what a hybrid approach would look like and how it would operate, the White House ushered in yet another layer of political complexity and confusion to the debate. On Monday morning, in an unprecedented move, President Obama announced in a video address that he had asked the FCC to classify all internet services – mobile and fixed – as Title II under the 1934 Communications Act. Never before has a President publically directed the FCC, an independent agency, to do something this specific on a policy issue within the FCC’s oversight. While the President did note that the FCC is an independent agency and that ultimately the decision is theirs alone, his message couldn’t be any clearer. Anyone who is or ever has been in a relationship knows what the “the decision is ultimately yours alone” line really means.
The market response was swift, and predictable. The video address had the effect of resolving the uncertainty about whether the FCC was really, truly, seriously going to do Title II. Within hours of the announcement, the NYSE saw a drop of 4.5% to 7.6% in value among the largest ISPs by the close of the bell Monday. Some investment analysts such as Wells Fargo’s Marci Ryvicker estimate that the downside risk for cable stocks can be as much as 23% of their current value. And why did investors react so negatively to the President’s message? Simple. A Title II world minimizes future growth opportunities for ISPs. Equally scary to investors, a Title II world at this point in time spells regulatory chaos and legal wrangling for years to come, a scenario antithetical to low cost of capital and high investment.
President Obama’s foray into broadband policy could represent a major turning point in telecommunications and internet policy both for the United States and the world as a whole, if the FCC adheres to what the President requested. In a world where prices decline, services improve, and choices increase, this country’s most senior leader has decided that a heavy-handed regulatory framework developed 80 years ago is the right vehicle to grow jobs, attract investment and catalyze innovation in the digital economy. Unfortunately, the most likely scenario is that regulations designed for a monopoly world will bring us back to the regulated monopoly times where every incentive to exceed the government requirements was eliminated.
Governments in other countries, both democratic and less than democratic, will see this decision of the US government as an endorsement of their own efforts to more closely censure and close down the Internet within their borders.
By pursuing Title II, the government is hobbling a part of the most vibrant segment of the economy. How interfering into such an interdependent system with a bludgeon like Title II can lead to an improvement for the overall system is difficult to see. Title II was introduced into a steady-state, innovation-free system that did not change for the next 50 years as there was no incentive to change. The “strongest possible rules” that President Obama asks for is the same type of corset that will probably suffocate innovation and investment in mobile and fixed internet. For a thriving internet, both technologies and business methods of all players need to evolve, small and large alike. Innovation dies when it has to ask for regulatory approval. Adding insult to injury, Title II does not cure the alleged problem, paid prioritization. Title II does not prevent paid prioritization as long as the prioritization is available to everyone who purchases the exact same service.
The market has made it clear that it does not have an appetite for draconian government interventions here. Whether the FCC will appreciate the signals the market is sending is an open question, as is whether the FCC cares what the market thinks. For the record, the agency should care. Pushing out high speed broadband to more than 95% of the US population is a key objective of this Administration. A Title II world could very likely preclude that from ever happening if the market decides the regulatory risk is too high.