
The Transformer Transformed

The transformer architecture changed how AI processes information. Now AI is changing how data is processed. Every inference call is an act of data transformation: unstructured input goes in, structured and actionable output comes out.

Jensen Huang framed the AI buildout as a five-layer stack at Davos in January 2026: energy, chips, infrastructure, foundation models, and applications. Each layer serves the one above it. Hundreds of billions invested, trillions still required. https://blogs.nvidia.com/blog/ai-5-layer-cake/

The question is whether value creation at the application layer justifies the capital deployed beneath it. Our reading is that the application layer serves a dual function. It transforms data into value and creates applications that use transformed data.

The tools themselves accelerate this cycle. AI loads information into AI-accessible repositories, builds data dictionaries that facilitate contextual understanding, and creates metadata that speeds retrieval while reducing context consumption. Databases become regeneratively improved resources. Each query refines the schema. Each insight tightens the data dictionary. Each workflow creates reusable context. The database becomes a collaborator, not a repository.

Our survey of 212,382 U.S. respondents between March 2025 and March 2026 tracks where this transformation is working and where it is stalling.

The Integration Gap

Among the 48,330 work users in our survey, the number one feature that would motivate an upgrade from free to paid AI is integration with apps, cited by 22.7%. Improved generative quality comes second at 19.2%.

The satisfaction data tells the same story. Integration satisfaction among work users scores an NPS of negative 10.1, the lowest of any dimension we measure for this group. Overall satisfaction scores positive 9.1. Productivity satisfaction scores positive 5.9. Work users find AI productive. They do not find it connected.

AI is solving its own integration problem. The early phase required users to carry data between tools manually. The current trajectory is direct connectivity: connectors, APIs, and open standards like Model Context Protocol are giving AI live access to databases, CRMs, email, calendars, and document repositories. AI enriches the data it touches, builds context from usage patterns, and makes each subsequent query against that data more productive. The integration gap is closing because AI is the mechanism that closes it.

Huang’s five-layer stack is the right framework. Our data adds a dimension to it: the application layer is not just consuming infrastructure, it is improving the data that feeds back into the stack. The integration gap measures how much of that feedback loop remains to be connected. As connectivity improves, the return on every layer beneath it compounds.

The Transformation Premium

Users start with retrieval: web search, writing assistance, topical research. These require no user data. As users build fluency, they move toward transformation: data analysis, software coding, workflow automation. These require enterprise data. The economic difference is substantial.
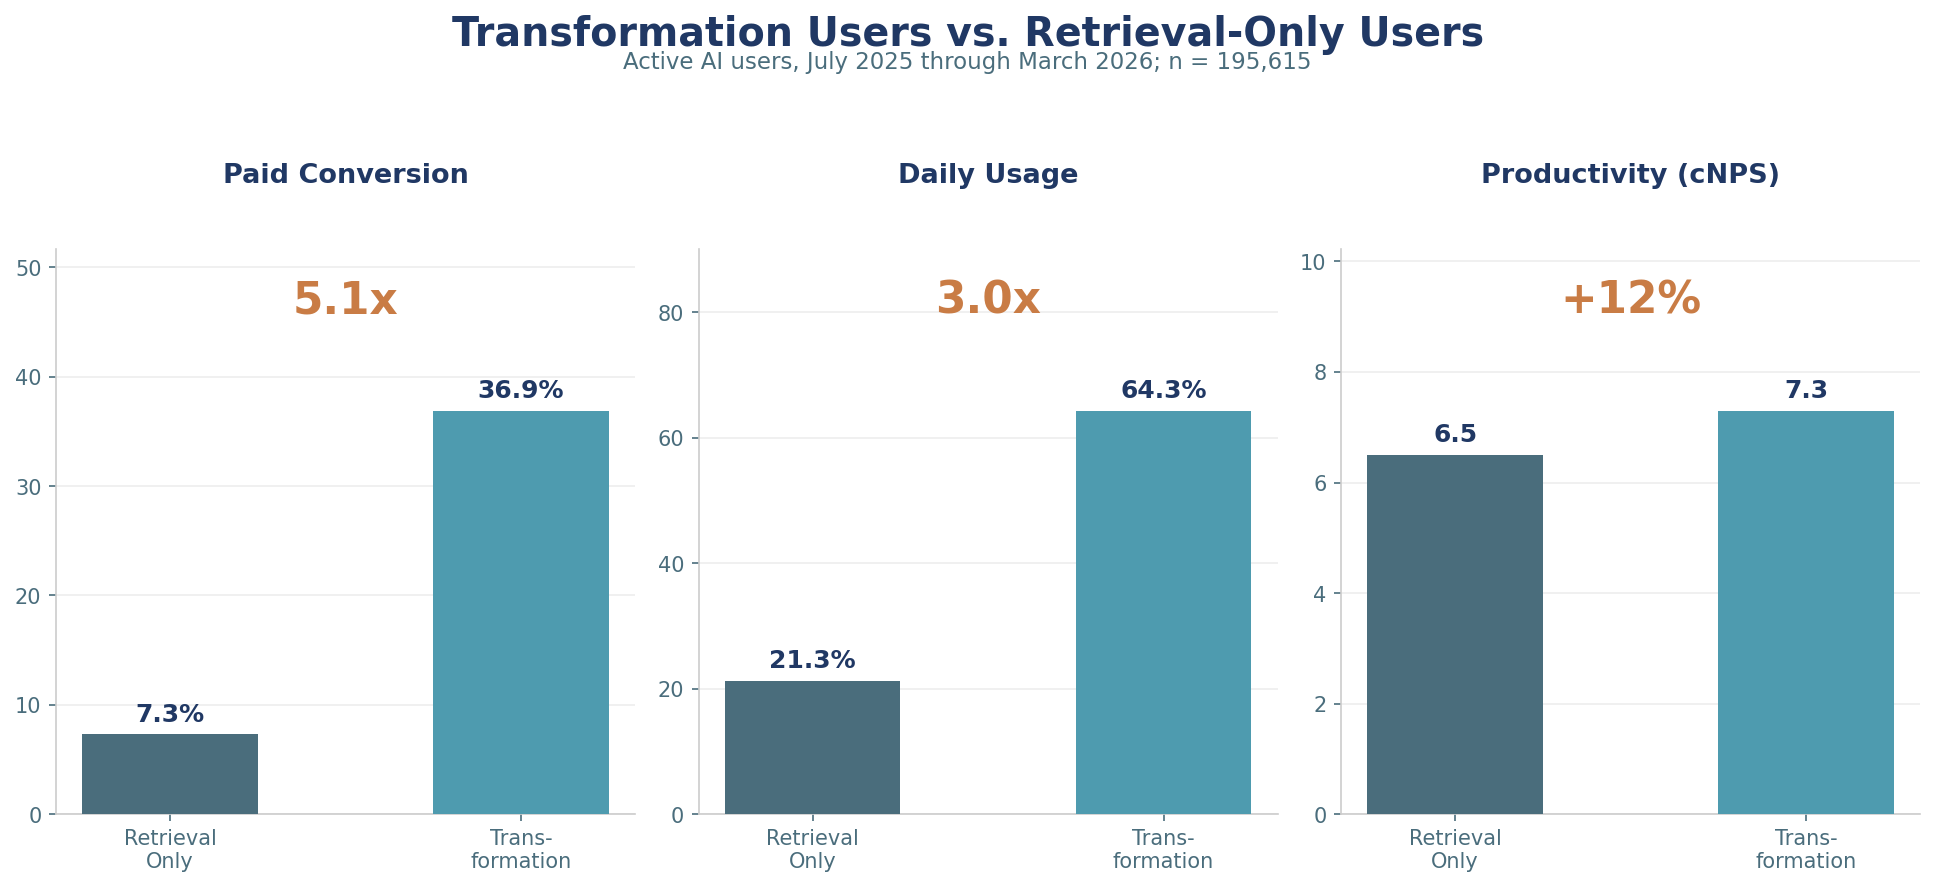
Users who employ at least one transformation use case convert to paid subscriptions at 31.6%. Retrieval-only users convert at 13.3%. That is a 2.4x differential across 113,121 respondents. Software coding users convert at 40.2%. Automation users at 37.0%. Data analysis at 31.3%. The baseline for web search is 16.6%. Every metric moves in the same direction: users who connect their data to AI pay for it.
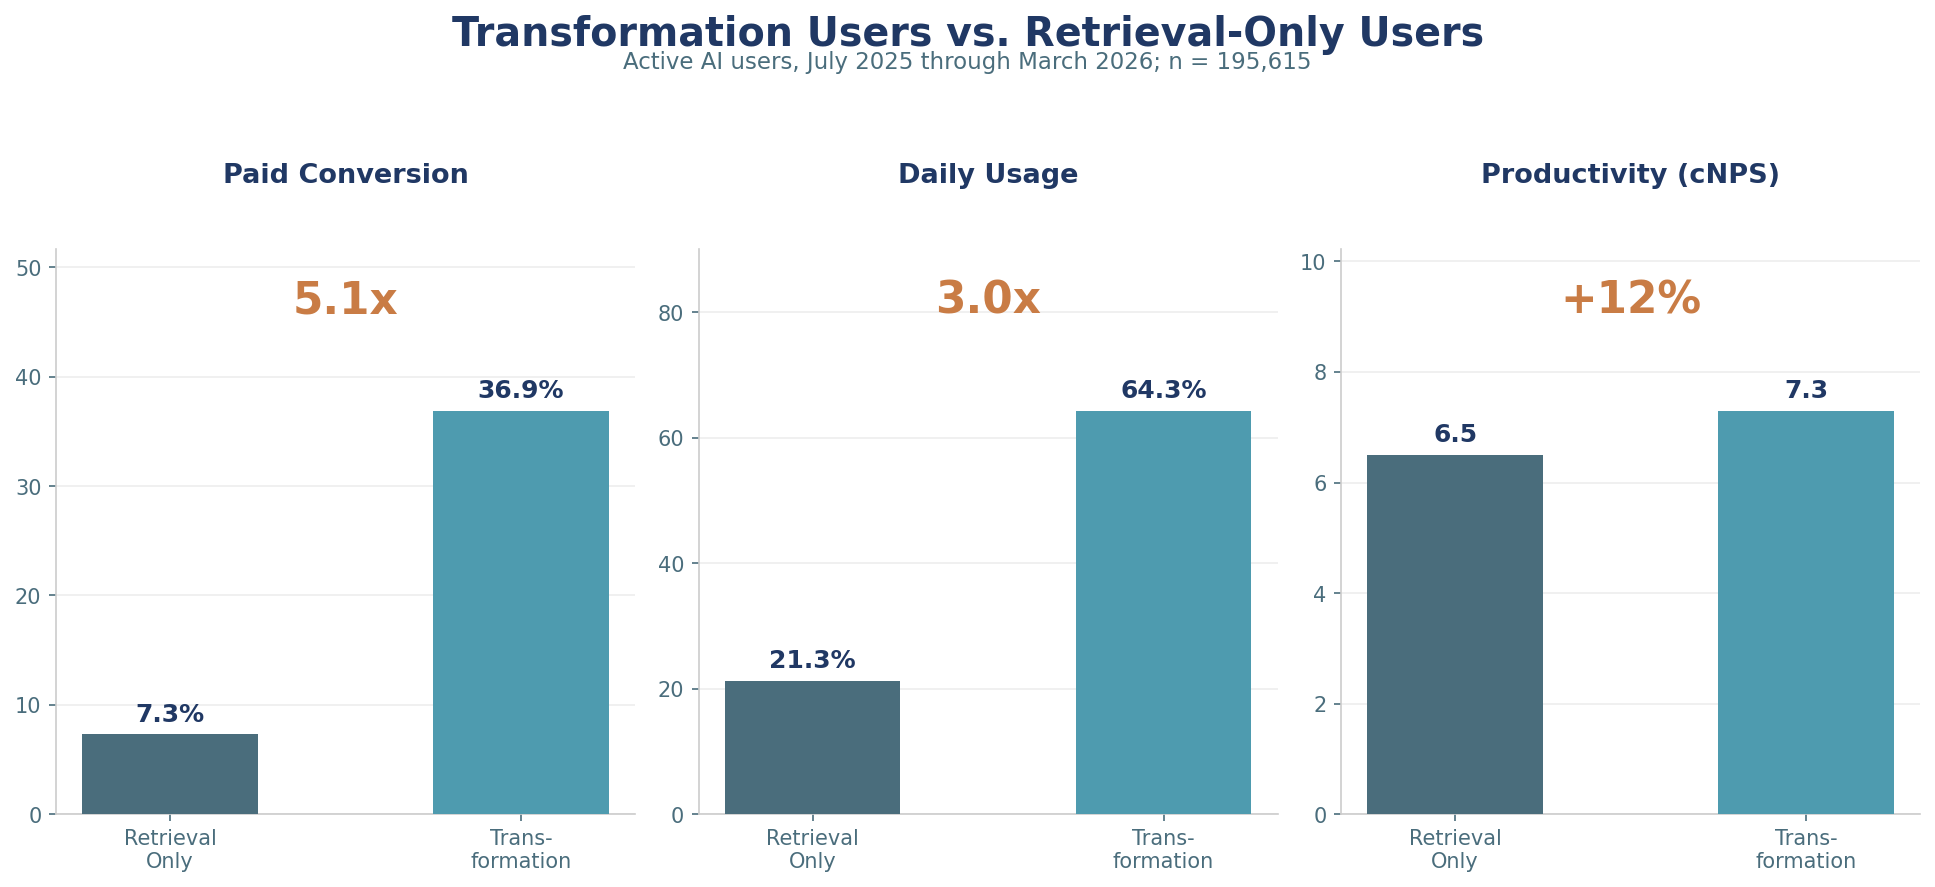
Among workers using AI, 64.9% save three or more hours per week. The value is not the hours saved. It is what those hours produce. Workers with paid AI tools perform analysis they could not previously perform, on data they could not previously access, at speeds that make the work economically viable for the first time. This is expanded output, not cost savings.

Implications for the Stack

The return on AI infrastructure investment is not measured in model benchmarks. It is measured in the volume and value of data transformations the economy can now perform. Cost savings create one-time value capture. Expanded output creates recurring value, drives additional inference demand, and justifies additional infrastructure investment. The flywheel is real. But it runs on data connectivity, not model capability.

The 56.3% of active users who increased their AI usage in the prior three months are climbing the transformation curve. The 19.7% of work users who say they would never pay represent users who have not yet encountered a use case that touches their own data, or whose employers restrict AI integration with enterprise systems. Both conditions are temporary.

The embedded AI thesis assumed that placing AI inside productivity tools would solve the integration problem. Our data from the Recon Analytics User Illusion report suggests otherwise: Microsoft Copilot lost 7.3 percentage points of paid subscriber share in seven months despite being embedded in the most widely deployed productivity suite in the world. Embedding AI inside one application does not help when the work crosses applications. The integration gap is not between the user and AI. It is between the data sources AI needs to access.

Standards like Model Context Protocol address this directly. Rather than embedding AI inside every application, MCP allows AI to reach across applications from a single interface, connecting to databases, CRMs, email, calendars, and document repositories simultaneously. The platforms that build trusted connectors to enterprise data will capture the transformation premium. The platforms that confine AI to a single application will continue to lose share to those that do not.

The regenerative data layer is what makes the infrastructure investment compound. Unlike previous technology cycles where hardware depreciated and software required constant replacement, AI-enriched data environments improve with use. The data dictionary grows. The context layer deepens. The retrieval cost per query declines. Every dollar of infrastructure investment seeds a data asset that becomes more valuable over time.

The trillion-dollar question behind Huang’s stack is whether the applications at the top justify the infrastructure at the bottom. Our data says they do, but only when AI can reach the data. The 22.7% of work users asking for integration are telling the industry what comes next. The capex has been deployed. The models work. The data is there. The returns now depend on connecting them.


Methodology: Based on the Recon Analytics U.S. AI Survey, 212,382 business and consumer respondents surveyed between March 14, 2025 and March 6, 2026. Upgrade trigger analysis based on 48,330 work users and 57,863 home-only users. Paid conversion analysis based on 113,121 respondents with free or paid status recorded. Productivity NPS uses standard NPS methodology (promoters minus detractors on a 0–10 scale). Integration NPS based on 43,718 work users with satisfaction scores. Willingness to pay based on 21,915 work users who named a price. Note: The AI100045 use case battery was expanded in Q3 2025, creating a discontinuity in adoption rates for that question series; use case adoption rates cited in this paper are drawn from the AI100020 series, which remained consistent across the full survey period. All percentages unweighted. Recon Analytics is an independent research firm. This analysis was not commissioned or funded by any AI platform vendor, chip manufacturer, or cloud infrastructure provider.

Based on interviews with 193,266 Americans conducted between March 2025 and February 2026

A massive and largely quiet transformation is underway in the American workforce. Recon Analytics tracks AI adoption through weekly pulse surveys of over 300,000 respondents annually. The data reveals that 42% of employed AI users now direct those tools toward work tasks, generating an estimated $420 billion in annual productivity value. Only half of these workers say their adoption came through any formal company program. The other half found their own way.

The Workforce Picture

33% of employed Americans now use AI for work tasks. Among knowledge workers in financial services, professional services, scientific and technical fields, communications, media, law, healthcare, education, and government, the rate is 37%. Among employed people who already use AI in any capacity, 42% use AI tools in their jobs.

Workers Are Leading, Companies Are Following

Work AI users who answered questions about their adoption pathway (n=20,934 since July 2025), roughly half report either using AI independently or working at a company with no formal AI initiative. 20% say they adopted AI through a deliberate, self-directed choice with no company involvement at all; another 38% report their company has no formal AI initiative or they are unsure whether one exists. The workforce is pulling AI adoption forward while many organizations are still debating governance frameworks.

For those who can identify initiative drivers, executive leadership accounts for 33% and IT departments for 47%. These figures overlap because respondents can select multiple drivers. The gap between the 47% who credit IT and the 50% operating outside any formal program is a governance challenge.

Who Pays for AI

29% of work AI users pay for a premium subscription to their primary tool. Employer or team funding covered 40% of paid subscriptions in August 2025. That figure has climbed to 50% in February 2026. Corporate procurement is catching up, while half of all paid work AI subscriptions still come out of workers’ own pockets.

Workers spending $20-30 per month of their own money on AI tools they believe make them more productive, without being asked and often without their employer’s knowledge, is a revealed preference. These workers have already conducted the cost-benefit analysis that many enterprise procurement processes are still debating.

Retention Is Strengthening, Not Weakening

For work AI users on paid subscriptions, cancellation intent has declined steadily from 26% in August 2025 to 20% in February 2026. The trajectory is consistent: Four in five paid AI subscribers plan to keep paying.

A 20% cancellation rate in a product category barely two years old compares favorably to mature SaaS categories that typically see 25-35% annual churn in their first 18 months. The downward trajectory suggests that workers who survive the first few months of paid use are settling into habitual usage patterns. Paid AI has crossed from experiment to infrastructure.

The Productivity Signal

Among 18,117 work AI users surveyed over the last 90 days, 97% report at least one tangible benefit and 94% report measurable time savings. The top benefit is increased productivity and efficiency at 45%, followed by quick generation of actionable information at 34%, enhanced decision-making at 28%, and automated repetitive tasks at 24%.

Workers who report hours saved (n=16,154) average 6.3 hours per week. Some of AI’s productivity value does not register as “hours saved”, a developer who writes cleaner code the first time, a marketing analyst who produces three campaign variants instead of one, a sales rep who personalizes 50 outreach emails instead of sending one generic blast: none of these show up as recovered hours. They show up as better output. Self-reported time savings captures one dimension of a multi-dimensional productivity gain.

Based on 161.3 million employed Americans (BLS, 2024 annual average), with 33% using AI and 42% of those directing it toward work, approximately 22 million workers are using AI on the job. At the self-reported mean of 6.3 hours per week and BLS total compensation of $48.05 per hour for civilian workers (Employer Costs for Employee Compensation, June 2025), the annualized productivity value is approximately $340 billion. Adjusted for the occupational skew of AI work users toward professional, technical, and financial roles that carry above-average compensation, the estimate reaches approximately $420 billion in annual productivity value.

What This Means

For enterprise IT leaders, internal AI adoption metrics almost certainly undercount actual usage. Dashboard-tracked deployments of Copilot, Gemini for Workspace, or other enterprise-licensed tools capture only the formal channel. Workers using personal ChatGPT Plus, Claude Pro, or Perplexity subscriptions on their own devices are invisible to those dashboards. The opportunity is to channel demonstrated demand into governed platforms.

For AI platform vendors, employer-funded subscriptions grew from 40% to 50% of paid work AI users in six months. That trajectory points toward corporate procurement absorbing what workers started on their own. The conversion trigger for free users considering paying is integration with existing productivity applications: Microsoft 365, Google Workspace, Salesforce. Prior reports have noted that Enterprise data infrastructure expansion will clearly grow both enterprise paid usage and business impact.

The comprehensive report providing deeper analysis, conclusions, and recommendations is available on ReconAnalytics.com.


Methodology: Recon Analytics AI Pulse Survey. Continuous weekly data collection, March 2025 to present. Total respondents: 193,266 (n=16,154 for hours-saved analysis, last 90 days). Monthly sample sizes range from 944 (March 2025, early panel) to 34,253 (October 2025, full panel). Quality controls reject unqualified responses at 4-10x the industry standard. Productivity value calculation: BLS Employer Costs for Employee Compensation (ECEC), June 2025 release, civilian workers total compensation $48.05/hour; BLS Current Population Survey, 2024 annual average, 161.3 million employed.

Contact: [email protected]

Eight breakthrough model releases in seven months produced four percentage points of daily usage growth. 75% of Americans have tried AI, but only 25% use it daily. The bottleneck is not intelligence. It is trust and context. Privacy scores -30 cNPS across the entire AI ecosystem, the lowest attribute by 28 points, based on more than 120,000 respondents surveyed over 38 weeks. Users who connect AI to their private data convert to paid subscriptions at 3x the rate of those performing basic tasks. The model capability race has hit diminishing returns. The next phase belongs to whoever solves the data infrastructure problem for consumers and enterprise.

The 50-Point Gap Between Trial and Habit

Three out of four Americans have tried an AI tool. One in four uses it daily. The 50-point spread between trial (76%) and habitual use (26%) is not a marketing problem. It is a utility problem.

The middle of the funnel defines the conversion opportunity. 19% of respondents use AI weekly, suggesting it occupies a place in their routine but has not become essential. Another 10% use it monthly. Combined with the 21% who tried AI and walked away, these cohorts represent half the population: consumers who engaged with AI and did not find sufficient value to stay.

The demographic surprise: Millennials, not Gen Z, are the heaviest users. Daily usage peaks in the 30-44 age bracket at 36%, five points ahead of 18-to-29-year-olds at 31%. The explanation is context and compensation. Mid-career knowledge workers face more tasks that align with AI capabilities. The inflection arrives at 60, where daily usage drops to 11%. Seniors have not rejected AI. Nobody has shown them what it can do.

Privacy Is Both the Lock and the Key

45% of Americans remain outside the AI economy. Among those who have never tried AI, 44% cite lack of interest, 25% cite ethical concerns, and 24% cite distrust of AI answers. Cost ranks last in both the never-tried and tried-and-quit segments. Only 5-9% cite expense as a barrier. Free versions exist for every major platform. Price is not the obstacle.

Privacy is the top barrier and the top motivator. 21% of never-tried respondents say knowing their data would be safe and private would motivate them to try AI, the only response exceeding 20%. The same consumers who say they do not trust AI say privacy assurance would bring them in. This is not a contradiction. It indicates that trust is the gate through which new users must pass.

Among active users, the picture is worse. Privacy scores -30 cNPS, nearly 28 points below complete experience (-2). Every platform in the dataset reports negative privacy cNPS, from Perplexity at -18 to Meta AI at -43. Zero for twelve. Apple Intelligence scores -25, underperforming its privacy-centric brand positioning. Payment helps: paid users report -9 versus -34 for free users, a 25-point lift. But no platform achieves positive territory.

ChatGPT Dominates. Satisfaction Tells a Different Story.

ChatGPT leads primary platform selection at 50%. Google Gemini follows at 20%. Microsoft CoPilot (8%), Apple Intelligence (6%), and Meta AI (6%) form a competitive middle tier. The top four platforms represent 83% of primary selections.

Scale inversely correlates with satisfaction among free users. Perplexity, at less than 1% share, posts cNPS of +8. ChatGPT, at 48% of free users, registers -1. Google Gemini scores -6. The pattern is monotonic: larger user base, lower satisfaction. Smaller platforms attract self-selected enthusiasts who chose the tool deliberately. Larger platforms accumulate casual users through distribution advantages and brand awareness.

Paid users report higher satisfaction across every platform without exception. The aggregate cNPS gap: +18 for paid versus -7 for free, a 25-point differential. ChatGPT moves from -1 to +25. Payment is not a gamble. It is a reliable upgrade across the board. The challenge is getting users past the trust barrier to that first payment.

The 3x Conversion Divide

The use case hierarchy is steep. Web search leads adoption at 43%, followed by writing assistance at 33% and topical research at 26%. These information retrieval tasks require no private data, no account connections, no infrastructure beyond the prompt itself. Transformation use cases cluster at the bottom: data analysis at 20%, coding at 9%, automation at 9%.

The conversion gap tells the real story. Coding assistance converts at 41% to paid subscriptions. Automation follows at 37%. Data analysis converts at 31%. Information use cases trail: web search at 17%, topical research at 21%. The 2x gap between transformation and information use cases is not about features. Both tiers offer the same use cases. This is about user profile. Users who need transformation already have infrastructure that makes AI valuable.

Crossing work context with subscription status creates four segments with dramatically different satisfaction profiles. Work + Paid users report productivity cNPS of +23. Home + Free users report -20. The 43-point gap defines the challenge for consumer AI. A Home + Paid user (-1) is no more satisfied than a Work + Free user (-1). Work context provides more satisfaction improvement than payment alone. The difference between +23 and -1 is the combination of subscription plus infrastructure, not the subscription by itself.

The Second Inning Is About Data, Not Models

Data-dependent users, the 18% who employ AI for data analysis or automation, report productivity cNPS of +9 versus -13 for non-data users. They show 61% daily usage versus 28%. They convert to paid at 32% versus 9%, a 3x advantage. This minority demonstrates the engagement and monetization patterns every platform seeks. When users connect AI to their private data, they use it more, value it more, and pay for it more.

The entities with access to private data are not primarily AI companies. Apple holds photos, messages, health data, and financial transactions for over a billion users. Google holds Drive documents, Gmail archives, and location history. Microsoft holds OneDrive files and Outlook correspondence. These companies have the Organize and Unify layers that AI platforms lack. The strategic landscape creates natural partnership opportunities: AI platforms have models but need data access; device and cloud providers have data but need AI differentiation.

The shift is from “ask me anything” to “help me with my data.” The former is a party trick that saturates quickly. The latter is a utility that compounds with use. The stronger engine is ready. It needs better tires for traction.


Report Details

Genius Myopia: Why Smarter Models Aren’t Enough

How Trust and Context Unlock the Next Stage of Adoption | March – December 2025

The complete 23-page report includes detailed analysis of:

  • Usage frequency distribution and demographic breakdowns across age and income segments
  • Barrier analysis for the reluctant 45%, including never-tried and tried-and-quit segments
  • Platform-by-platform market share, satisfaction, and subscription dynamics
  • The O/U/T Framework: Organize, Unify, Transform as the value creation model for consumer AI
  • Connectivity as infrastructure proxy: fiber converts at 2x the rate of cable for paid AI
  • Privacy cNPS across all twelve platforms and the payment improvement effect
  • The Second Inning Playbook for AI Platforms, Device OEMs, Cloud Providers, and Investors

📊 View Report Details & Purchase →

For licensing inquiries: [email protected]

Despite Microsoft’s enterprise distribution advantages and Office 365 integration, Microsoft Copilot lost 7.3 percentage points of paid subscriber share in seven months while Google Gemini gained 2.9 points, based on more than 150,000 respondents. Distribution advantages do not lock in market position. Employees receiving enterprise AI tools evaluate options and select based on experience. The platform that delivers the most reliable results wins, regardless of vendor seat licenses.

The 39% Market Contraction

Copilot’s decline from 18.8% in July 2025 to 11.5% in January 2026 represents a 39% contraction in market position among U.S. paid AI subscribers. This occurred during a period when Microsoft actively invested in enterprise distribution and deepened Office 365 integration. The platform accesses the same OpenAI models as ChatGPT, so underlying capability is comparable. The divergence in user perception points to product experience and integration execution rather than model quality.

ChatGPT maintained dominant share near 55.2% with modest erosion from 60.7% in July. Gemini climbed from 12.8% to 15.7%, crossing Copilot in late November to claim the number-two position. The two platforms now separated by more than 4 percentage points, with Gemini’s trajectory continuing upward while Copilot stabilized in the 10-12% range.

Exhibit 1: Primary Platform Share Among U.S. Paid AI Subscribers


Source: Recon Analytics U.S. AI Survey, July 2025 – January 2026. U.S. paid subscribers only.

The Workplace Conversion Gap

When Copilot is the only AI platform an employer provides, 68% of workers adopt it as their primary tool. This demonstrates meaningful uptake when alternatives are absent. The competitive dynamics shift when employers offer multiple platforms.

Among workers with both Copilot and ChatGPT available, Copilot’s adoption falls to 18% while ChatGPT captures 76%. When all three major platforms are available, only 8% choose Copilot while 70% choose ChatGPT and 18% choose Gemini. The pattern is consistent: as worker choice expands, Copilot adoption collapses.

ChatGPT converts 83.1% of U.S. paid subscribers who have workplace access. Copilot converts 35.8%. Gemini converts 34.0%. The 47-point gap between ChatGPT and Copilot quantifies the adoption challenge. Microsoft’s Office 365 distribution creates exposure. That exposure does not automatically translate to preference when workers evaluate alternatives.

Exhibit 2: Workplace Conversion Rates by Platform


Source: Recon Analytics U.S. AI Survey, July 2025 – January 2026. Workers with paid AI subscriptions only.

Quality Perception Drives Share Movement

Gemini’s rise correlates with quality leadership. The platform posts the highest accuracy satisfaction scores among major competitors, 23 points above Copilot and 9 points above ChatGPT. Copilot’s decline correlates with the lowest accuracy perception in the market. Quality drives share movement, not deployment volume.

Copilot’s accuracy NPS remained persistently negative throughout the measurement period. July showed -3.5, September declined to -24.1, and January finished at -19.8. The gap is not closing. Users who tried Copilot and stopped using it cited distrust of answers at 44.2%, exceeding comparable figures for Gemini (42.8%) and ChatGPT (40.6%).

The correlation between accuracy perception and market share movement is direct. Platforms investing in quality gain share. Those relying on ecosystem integration without matching quality lose share.

The Enterprise Market Remains Contestable

Multi-platform enterprise deployment is common. Among U.S. paid subscribers with Copilot available at work, over half also have ChatGPT available. Workers evaluate options and select based on experience rather than defaulting to whatever platform their employer provisions.

The enterprise AI market is not winner-take-all. Every renewal cycle presents an opportunity for challengers to displace incumbents based on demonstrated superiority. Microsoft’s enterprise dominance in productivity software does not foreordain Copilot’s dominance in AI. Google’s Workspace position does not guarantee Gemini’s success. The platforms that execute on accuracy, integration, and use case demonstration will capture enterprise spend in 2026.

ChatGPT’s 83.1% workplace conversion rate and 55.2% market share reflect entrenched product-market fit. Competitors are not displacing ChatGPT. They are competing for second position. Gemini demonstrated that share can shift when product experience improves. Copilot demonstrated that share can decline when it does not.


Report Details

User Illusion: Licenses Don’t Equal Adoption

U.S. Paid AI Subscriber Market Analysis | July 2025 – January 2026

The complete 24-page report includes detailed analysis of:

  • Platform-by-platform strategic implications for Microsoft, Google, and OpenAI
  • Use case performance across web search, research, writing, coding, and data analysis
  • NPS trajectories showing accuracy perception trends over seven months
  • Churn intent and retention dynamics by platform
  • Investment theses for enterprise AI market positioning

📊 View Report Details & Purchase →

For licensing inquiries: [email protected]

On January 16, 2026, OpenAI announced plans to test advertisements in ChatGPT’s free tier and the new $8/month “Go” tier in the United States. The move was widely anticipated: advertising funded the scaling of Google Search and Facebook and has been expected as the monetization path for consumer AI services. With OpenAI reportedly losing over $11.5 billion in Q3 2025 and projecting infrastructure spending of $1.4 trillion over the next eight years, the decision reflects economic necessity rather than strategic pivot.

Our analysis of 117,467 U.S. consumers from the Recon Analytics US_AI Survey reveals the consumer dynamics underlying this decision—and the structural challenges that limit OpenAI’s advertising ambitions.

Metric Finding Implication
Free users unwilling to pay 40% Logical ad audience
Ads as switch trigger 31.6% Monitor for churn
NPS impact if ads added -50% likelihood Implementation matters

Source: Recon Analytics US_AI Survey, May-December 2025; n=117,467

The Monetization Logic

ChatGPT commands 48.5% usage share in the U.S., far ahead of Google Gemini at 18.5%. Only 22.3% of ChatGPT users pay for the service, creating a substantial free user base where advertising represents incremental revenue that would otherwise not exist. Among free users, 40% indicate they would never pay for AI services at any price point. For this segment, advertising is the only viable monetization path.

Platform Share Paid Rate Has Ads
ChatGPT 48.5% 22.3% Coming Soon
Google Gemini 18.5% 12.5% No Plans
Microsoft Copilot 8.0% 27.4% No
Claude 4.3% 35.7% No

Source: Recon Analytics US_AI Survey, May-December 2025; n=117,467

Pioneer’s Peril: The Competitive Reality

OpenAI faces what we term “Pioneer’s Peril”: being first to test AI advertising while helping incumbents refine their approach. Google and Meta will defend aggressively. Advertising represents 77% and 97% of their respective revenues, totaling approximately $456 billion in 2025 and controlling roughly 50% of the global digital ad market. Both already deploy AI-powered ad tools. Google’s Performance Max and AI Max deliver 14% average conversion lifts; Meta’s Advantage+ shows 22% ROAS improvements. The six major agency holding companies control approximately 30% of U.S. ad spend with established workflows and proven ROI benchmarks. Switching costs are material—not technical, but institutional.

Digital advertising already represents 82% of total ad spend globally. OpenAI cannot rely on a secular shift from traditional media; that transition is complete. Any meaningful revenue must come from the existing $777 billion digital pool. Capturing even 1% ($7.8 billion) would require displacing entrenched competitors with superior targeting, measurement, and advertiser relationships that do not yet exist.

User Sentiment: A Window of Opportunity

Ads rank last among current user concerns at just 2%, well below privacy (27%) and job displacement (29%). Users have not yet formed strong negative associations with AI advertising. Whether this remains true depends entirely on implementation quality. Nearly one-third of users (31.6%) indicate ads could trigger them to switch platforms, suggesting that intrusive or poorly executed advertising could accelerate competitive dynamics in a market where switching costs are minimal.

Concern % Citing
Job displacement 29%
Privacy 27%
Accuracy of responses 18%
Bias in AI 12%
Ads / sponsored content 2%

Source: Recon Analytics US_AI Survey; n=117,467

OpenAI’s decision to introduce advertising in the free tier follows sound business logic for user monetization. With 40% of free users indicating they will never pay, advertising represents the only viable revenue path for this segment. However, building a material advertising business faces structural headwinds. Google and Meta’s entrenched positions, AI-powered ad tools, and deep agency relationships create formidable barriers. The most likely near-term outcome is that ChatGPT advertising generates incremental revenue from the free tier but struggles to capture meaningful share of advertiser budgets from platforms with proven performance. We expect modest revenue contribution in 2025-2026, with OpenAI’s advertising ambitions likely measured in hundreds of millions rather than billions.

Methodology: Data from Recon Analytics US_AI Consumer Survey. Fielded May 1 – December 5, 2025. Total sample: n=117,467. Margin of error: ±0.3% at 95% confidence.
Source: Recon Analytics AI Survey Sample: n=2,958

The Opportunity and the Obstacle

OpenAI’s launch of ChatGPT Health last week lands in fertile ground. Recon Analytics surveyed 2,958 Americans in the days immediately following the announcement, the data tells a story of strong latent demand colliding with deep skepticism. 56% of consumers are interested in connecting health apps to AI, but only 28% trust AI to provide accurate health information.

When asked about interest in connecting health and fitness apps to AI assistants, 56% of respondents expressed interest:

  • 10% very interested
  • 37% somewhat interested

A majority want personalized health guidance from AI. OpenAI isn’t creating demand here; they’re responding to it.

Consumer Interest in Health App Integration
Very Interested 20%
Somewhat Interested 37%
Not Very Interested 13%
Not At All Interested 13%
Don’t Use Health Apps 18%

The Trust Deficit

Here’s where the story gets complicated. Only 28% of respondents trust AI to provide accurate health information: 7% completely trust and 21% mostly trust. Nearly half, 46%, land in the ambivalent middle with ‘somewhat trust.’ The remaining 26% actively distrust AI for health guidance.

When asked about sharing personal health data with AI, only 33% expressed comfort: 10% very comfortable and 22% somewhat comfortable. A full third, 33%, are uncomfortable sharing health data with AI systems, and another 34% sit on the fence.

Trust in AI for Health Information
Completely Trust 7%
Mostly Trust 21%
Somewhat Trust 46%
Do Not Trust Much 15%
Do Not Trust At All 11%

The Interest-Trust Gap

The most revealing finding emerges when you cross-tabulate interest against trust. Of the 1,668 respondents who expressed interest in health app integration, only 38% also trust AI for health information. That means 62% of interested consumers harbor reservations about the very thing they want to use.

OpenAI has captured the attention of a majority but must earn the trust of that majority before they share their Apple Health data, lab results, and medication lists. The 260 physicians OpenAI consulted, the isolated health conversations, the commitment not to train on health data: these aren’t marketing flourishes. They’re table stakes for clearing the trust bar.

Demographics of Doubt

Trust and comfort vary meaningfully by age. The 30-44 cohort shows the highest trust (33%) and comfort (38%), likely reflecting a generation comfortable with technology but old enough to have health concerns worth tracking. Adults over 60 show the lowest trust at 23% and lowest comfort at 26%, despite being the demographic with the most to gain from health monitoring.

Age Group n Trust AI for Health Comfortable Sharing Data
18-29 1,090 27% 33%
30-44 584 33% 38%
45-60 648 29% 36%
> 60 636 23% 26%

The Competitive Implication

For now, ChatGPT Health represents a well-timed bet on a real market. The demand exists. The product is here. The trust must be earned, one health conversation at a time.

This trust gap isn’t just OpenAI’s problem; it’s the industry’s opportunity. Any competitor that cracks the trust code faster than OpenAI has an opening. Google, Apple, Microsoft, and Amazon all have health ambitions and varying degrees of consumer trust. Apple has spent a decade positioning itself as the privacy-first technology company. If Apple leverages the just announced Google partnership and launches health AI features that leverage Apple Health data, the 62% of interested-but-skeptical consumers may find that more palatable than sending their health data to OpenAI’s servers.

Methodology

Recon Analytics surveyed 2,958 U.S. adults January 9, 2026. Data weighted to U.S. Census demographics. Margin of error ±1.8% at 95% confidence.